
Reliable information is essential for making the case for changes to deliver safe and healthy journeys to school. Robust data helps correctly identify problems, target populations, prioritise risk factors, and identify appropriate solutions.
Often, data is weak or even not available, particularly in low- and middle-income country settings. Given constraints on resources, data gathering exercises must be affordable. This is a key premise of many of the approaches included in this toolkit.
![]() SAFE STREETS
SAFE STREETS
Official data on injuries and fatalities in a school area is often unavailable, weak or incomplete. This is where school area assessments can prove effective in identifying the level of risk and the exposure of children to road traffic as they go to and from school.
This section provides a guidance on assessing risk, and basic information on crucial monitoring and evaluation processes, including establishing a baseline before implementation, and how to assess the ongoing impact of schemes. Alongside data on injuries, it is also important to collect wider data on perceptions of safety, and experiences of the built environment.
Whilst crashes can occur anywhere and at any given time, some locations have more crashes than others. Tackling road safety in these “hot spots” is one of the most traditional approaches to road safety and is known to reduce casualties. Identifying and focusing on these locations makes it possible to set priorities and maximise the impact of limited resources. On average, targeting high risk locations results in an 18% reduction in casualties, and in most cases is cost-effective.
Lists of all schools in the area can usually be obtained from local authorities, ideally in spreadsheet format. By analysing secondary data and speaking with the head teacher of schools, identify schools where there is a high rate of road traffic injuries and deaths. Examples of secondary data that may be of use in identifying hot spots are police data, hospital registries, newspaper reports, and school registries.
School Area Road Safety Assessments and Improvements (SARSAI) projects have used the following steps to identify schools with high rates of injury:
Appropriate schools for Amend-type interventions:
SARSAI focuses on schools where minor infrastructural improvements can lead to major reductions in road traffic injuries. If the school is near a major highway, it may not be a suitable candidate for SARSAI, because larger infrastructural changes such as overhead footbridges or major intersection alterations are not within the scope of SARSAI-based projects.
For more on Amend and SARSAI visit www.amend.org
At each school site visit, make a note of surrounding roads, school entrances (whether they are on a main road or side road), footpaths, existing traffic-calming measures, etc to assess whether the school is an appropriate choice for the project.
During the site visit, observe student flow at drop-off and pick-up times. Where are the heavy foot traffic areas? What hazards are the children exposed to on their journeys to and from school? If necessary ask permission to follow students as they travel by foot and make a note of any areas where accidents are likely.
Key features to look out for during sites visits are:
These interviews and discussions build a picture of what a student’s journey to school looks like. What are the challenges faced by the students, parents and school staff?
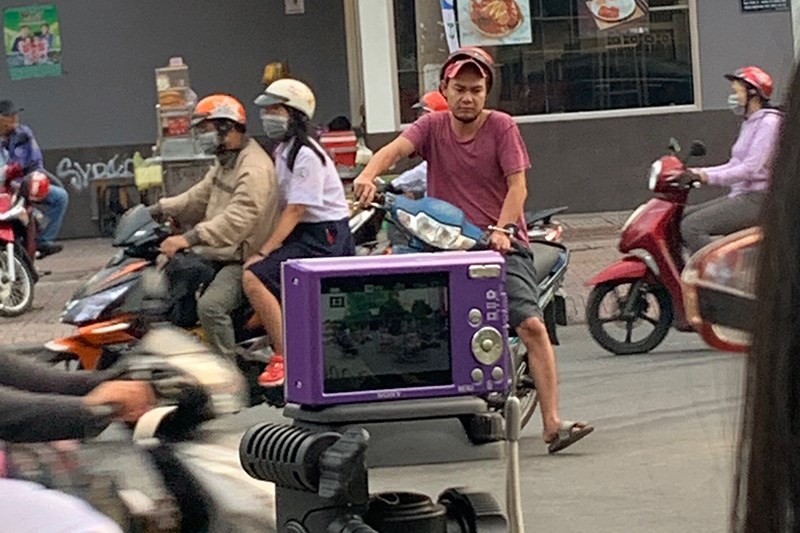
 Photovoice is a qualitative method of community-based participatory research which documents real life situations and commentaries surrounding a particular topic through the medium of photographs. Participants are asked to express their points of view surrounding a research topic, in this case road safety, by taking photographs, combining them with short narratives to give more context. Photographs are collaboratively interpreted and discussed by groups and can be used to highlight specific issues of concern by the participants. This then enables researchers as well as other stakeholders to identify the issues faced by the participants and promotes dialogue to develop effective solutions that address specific needs.
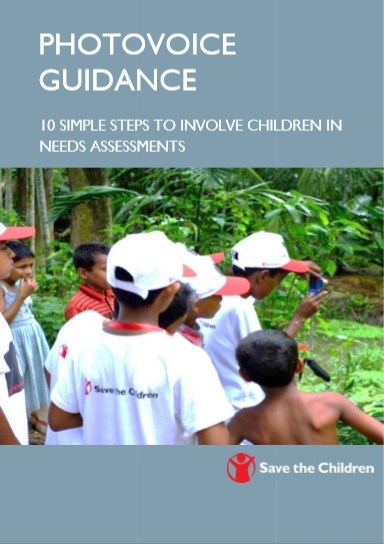
Save the Children have developed a 10-step guidance document on how to involve children in needs assessments using Photovoice:
Step 1: Sensitize the community and recruit participants
Step 2: Conduct a workshop to introduce participants and facilitators in order to establish group dynamics
Step 3: Set the project goals (remember objectives should be SMART)
Step 4: Get the children to focus on a specific thematic area (in this case the route to school)
Step 5: Introduce the use of cameras and photography to the children
Step 6: Provide guidance to children on how to “speak out through photography”
Step 7: Discuss strategies for taking pictures with the children
Step 8: Discuss ways to capture stories and develop captions for pictures
Step 9: Plan to exhibit or showcase the children’s pictures
Step 10: Go public through meetings, workshops, media, etc.
![]() The Save the Children Photovoice guide can be downloaded here.
The Save the Children Photovoice guide can be downloaded here.
Please be aware of the ethical and safety issues surrounding the involvement of children in projects of this nature. Be sure to obtain the necessary permissions at all levels before embarking on such a project.
Safe Kids Worldwide used Photovoice effectively to document the pedestrian-related issues facing children, parents and teachers through a project entitled: “PHOTOVOICE: Children’s Perspectives on Road Traffic Safety”. The project successfully captured on film the environments children faced while walking in Brazil, Canada, China, India, Korea, Mexico, Philippines, Thailand, the United States and Vietnam. A total of 5,743 photographs were taken by students aged 9-14 in the 10 countries. The subsequent discussions and accompanying narratives enabled participants to effectively advocate for permanent infrastructure changes which led to a safer journey to school for the students. Safe Kids Worldwide provided a number of grants to these communities permitting the implementation of permanent infrastructural changes to the risks identified through the photographs. A sample of before and after shots from this particular project can be found here.
Traffic volume studies are conducted to determine the number, movements, and classifications of roadway vehicles at a given location. They can help identify critical flow time periods, determine the influence of large vehicles or pedestrians on vehicular traffic flow, or document traffic volume trends. Similar to pedestrian counts, these are conducted around peak school times at the beginning and end of the school day and at 15 minute intervals at various locations around the school. Detailed instructions how to carry out a traffic volume count can be found ![]() here.
here.
Assessment of traffic speed around the school will be vital in determining high-risk areas and the effectiveness of traffic calming measures in reducing speed. ![]() Detailed instructions how to carry out a speed survey can be found in the 'Speed Observation Studies section'.
Detailed instructions how to carry out a speed survey can be found in the 'Speed Observation Studies section'.
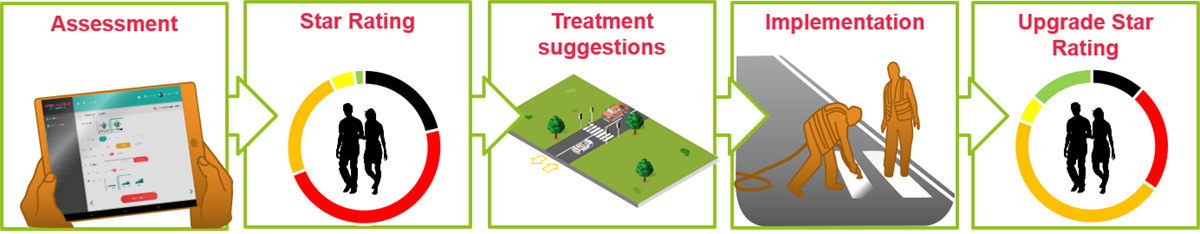
Advocate for road upgrades
Document the main findings, identify the potential countermeasures for the locations assessed and convey them to the different interested parties. Translate technical information into compelling messages that help the programme to connect to its stakeholders.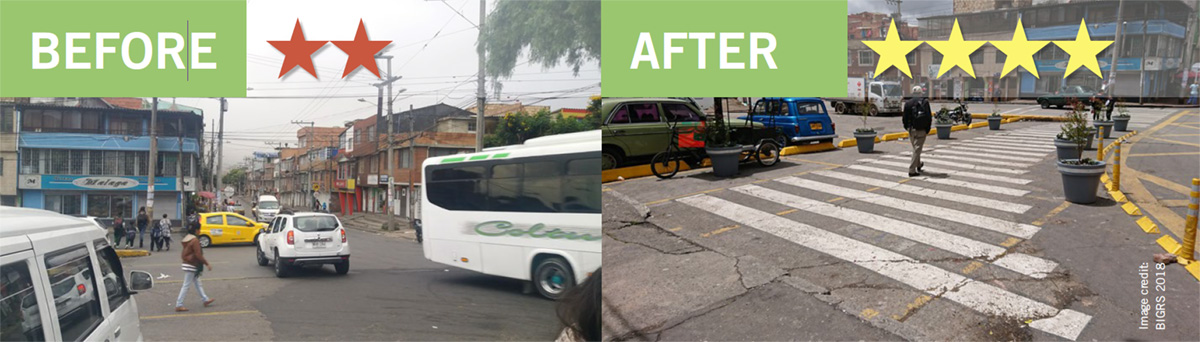
Monitoring and evaluation is an important aspect of any project and are often overlooked. Monitoring refers to the systematic collection of data regarding the performance of a road safety programme or intervention during or after its implementation. Evaluation involves the analysis of this data to determine the effectiveness of the programme.
Monitoring and Evaluation are fundamental aspects of good programme management:
| Quality | Accountability | Learning |
|---|---|---|
|
|
|
To ensure M & E is relevant to your stakeholders it is important that you consider their information needs, as well as your own. You will therefore need to identify the key internal and external stakeholders, and decide how to involve them in the design, implementation, analysis and/or communication of findings. Set up regular project team meetings to discuss M & E results.
It is useful to build the monitoring and evaluation framework alongside planning the intervention and base it around the main objectives of the project. Early M&E planning allows for preparation of adequate time, resources and personnel before project implementation. It also informs the project design process itself as it requires people to realistically consider how practical it is to do everything they intend to measure.
An agreed M&E framework is essential in order to carry out monitoring and evaluation systematically.
This framework serves as a plan for monitoring and evaluation, and specifies:
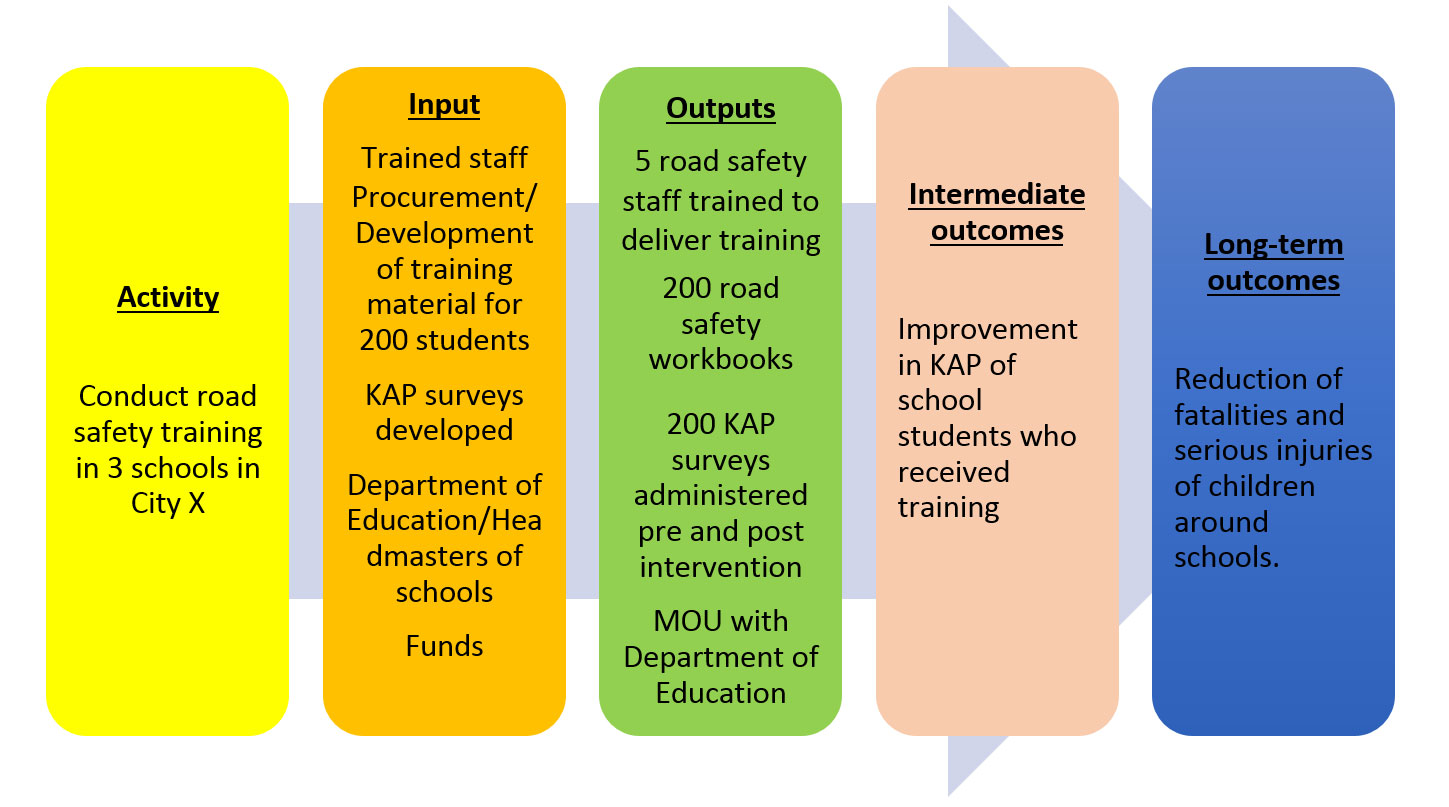
Linking project objectives and activities with indicators that can be used to measure processes is a fundamental aspect of planning M&E. This exercise can be aided by using simple templates such as the logic framework (see below) which subdivides project objectives into: inputs, activities, outputs, short-term outcomes, long-term outcomes, impact. In reality the pathway is unlikely to be linear as there maybe multiple outcomes and feedback loops along the way but visualising the project in the form of a change pathway can be useful.
Key concepts:
| Concept | Definition |
|---|---|
|
Aim |
The long-term change to which the project will contribute, e.g. reduction of child injuries / deaths / disabilities from road traffic crashes, in city X. The aim is usually a general statement about what the project hopes to achieve. |
|
Objectives |
Objectives are the specific steps that need to be taken in order to achieve the aim of the project. In other words, the “how” of the project. Objectives, therefore, always start with a verb, e.g. to collect, to test, to produce, to analyze, etc. They should be as specific as possible (remember SMART objectives: Specific, Measureable, Achievable, Reachable, Timebound). |
|
Inputs |
These are the key resources needed to support the project. They include human resources, funds, equipment, etc. |
|
Activities |
These are the interventions (or actions) that will be taken that will lead to the outputs. They can include workshops, trainings, infrastructural changes, enforcement, supervision, etc. |
|
Outputs |
These are the tangible results of the project such as the number of people trained, the number of workshops conducted, the number of zebra crossings painted, the amount of material distributed, etc. They should lead to the outcomes. |
|
Outcomes |
The outcomes are the changes that result from the intervention. They may be short, medium or long-term. They should directly relate to the aim/objective of the programme. They can include changes in knowledge and attitudes (short-term), changes in behaviour (medium term) and finally reductions in injuries, deaths and disability. |
Choosing the right indicators to measure inputs, outputs and outcomes will depend on what questions are needing to be answered so having a clear aim for the evaluation is essential. The breadth of an evaluation will always be limited by the resources available, but a well-designed, simple evaluation can be as useful as a more complex and costly one.
An indicator is a variable that measures some aspect of a program that is directly related to that program’s objectives. Indicators can be either quantitative or qualitative and will measure magnitude and changes. They should be:
Avoid vague indicators such as “number of people who “know” about speed reduction in the area.” Better to use “proportion of parents who can correctly state the new speed limit surrounding the school” as measured through a parent survey.
Examples of indicators for each part of the framework for the evaluation of a road safety program in a school are given below:
Generally, you are likely to need information to track and assess what has changed (both intended and unintended) and understand the reasons for changes - i.e. what factors/organisations/individuals have facilitated/constrained change (including your contribution). Secondary data sources such as police data, vital registries, school registers or hospital data may be available and often provide a good source of outcome data. However, as secondary data is not designed specifically for program needs, it is important to avoid the trap of using irrelevant secondary data just because it is available. Check the relevance of secondary data for:
There are many different types of studies that will help in collecting the necessary data for your indicators – they can be both qualitative and quantitative. Qualitative data such as in-depth interviews and focus group discussions can be used in the formative evaluation to provide information on why an intervention may or may not have worked and whether the program went to plan. There is a hierarchy of quantitative methods for examining the effectiveness of a program ranging from randomised-controlled trials to before-after studies with no control group. Whilst the former is more rigorous and is the gold standard by which evidence is assessed, it is also the most expensive type of evaluation to carry out. Conversely, the before-after study is cheaper, but it can only provide weak indicative evidence as to a program’s effectiveness. Using a quasi-experimental design such as a controlled before-after study is often more practical and involves measuring the outcome of interest e.g. vehicle speeds before and after the intervention for both the target population and an control population A control group allows trends that may have been occurring in the population separately from those happening as a result of the programme to be taken into account.
Types of studies that can be carried out are:
| Tool | Description | Usefulness | Disadvantages |
|---|---|---|---|
|
Survey |
Written questionnaire designed to measure indicators |
Systematic, can be given to a large number of people |
Not possible to explore answers in greater detail |
|
Interview |
Ask specific information regarding indicators |
Flexible, can be done in-person or by phone |
Requires interviewing skills so as not to ask leading questions |
|
Focus Groups |
Skilled facilitator mediates a conversation with 6-12 people |
Cheap, allows opinions from a larger group at one time |
People influence one another, feelings may not be shared honestly |
|
Observational study |
Roadside observations of risk factor behavior |
Relatively cheap. Allows estimation of risk factor behavior such as speed, seatbelt wearing rates, helmet wearing etc. |
Not always accurate and relies on observation skills of researcher leading to potential bias. Time consuming |
|
Mobility survey |
A self-administered questionnaire which collects data on usual mode of travel to school and road injury |
Reliable and valid method of data collection on mode of travel and attitudes surrounding road safety |
Time consuming and potentially costly. Need trained researchers. Large sample size. |
The methods used for the evaluation will depend on the aim and the budget for the evaluation. However there may be ways to reduce the costs of your evaluation. Ask yourself the following questions:
This will depend on your evaluation aims and your resources. At the very least you need to be collecting data on indicators at the very beginning of the project (to build a baseline) and at the end of the project. Collection of process and input indicators should be carried out throughout the implementation of the project. Ideally for observation studies it is useful to collect data at the beginning, part way through, at the end of the intervention.
Groups can learn from each other: what was useful, what worked, what tools can be shared, etc. Sharing of problems encountered and how these were overcome can benefit others and avoid time wasting in future work. Dissemination is important in enabling the PI to connect with other individuals, groups or organizations conducting similar projects (create a network).
Results can be shared through:
Amend, in partnership with the United States Centers for Disease Control and Prevention, conducted a multi-year population-based control study impact evaluation of SARSAI and found that the SARSAI programme results in a statistically significant reduction in the number of children injured in road traffic. For every 286 children whose schools are part of the SARSAI programme, one RTI is prevented per year. This is the first known road safety programme of any type proven to reduce RTI among children in sub-Saharan Africa. The methodology consisted of before and after household surveys in catchment areas of both intervention and control schools allowing for a more rigorous evaluation. Details of this evaluation can be found here.
School registers can provide a fast, simple and cheap means of injury surveillance. They may already possess an electronic or paper-based database of student attendance and collect data pertaining to the absence. It is worth approaching the headmaster to see if there is an existing system of reporting child absences. If there is none, it is good to ask about the feasibility of implementing one (or augmenting the existing one) with the help of school administration staff. It could be as simple as a logbook or a simple excel spreadsheet with drop down menus to record the following variables for any children reported as absent:
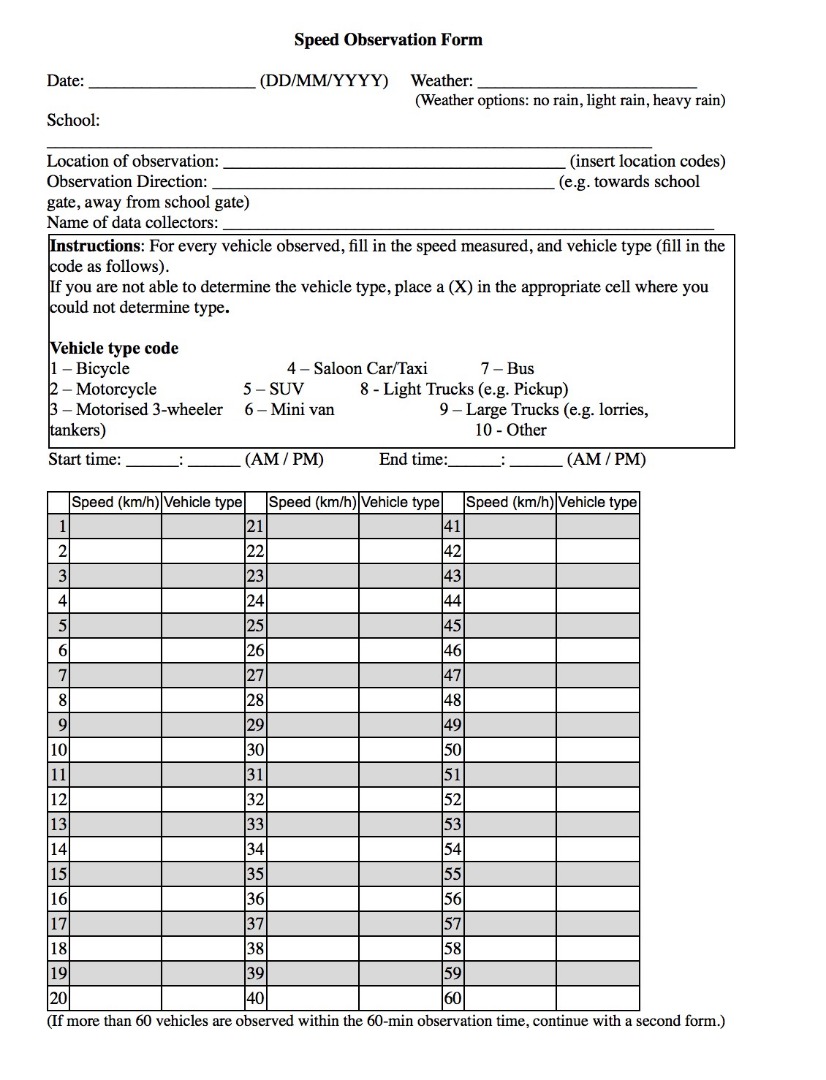
Speed data from specific sites like school zones is very hard to find. Often police data pertains to major highways, or if there is a speed camera within a school zone, harnessing that data from the relevant authorities may be problematic. Speed observation studies are a reliable way to obtain such information and can be used to help evaluate speed management to reduce child pedestrian injuries.
Site Selection
Area Review
During the area review, the investigator should note the following elements:
Timing of observations
Training
Field Documentation
Survey Tool
Speed observation forms are relatively easy to create as a word document and printed on A4 paper for data collectors to use on-site. An example from AMEND is shown below:
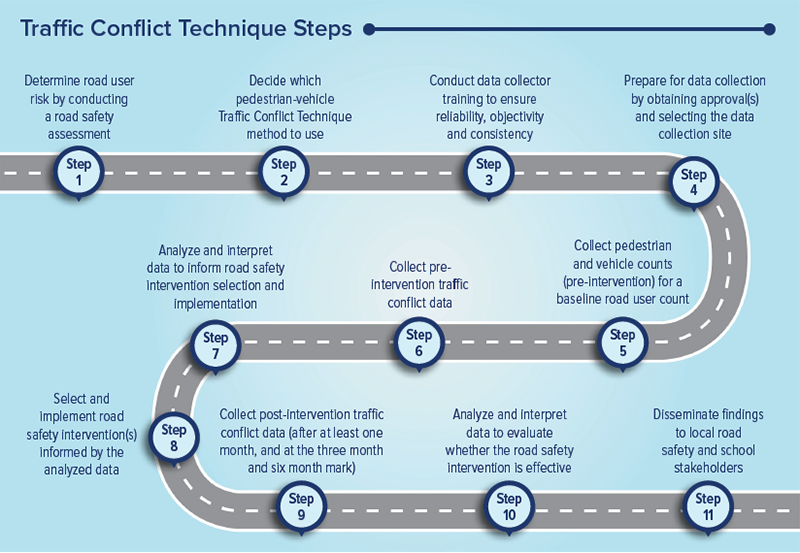
The Traffic Conflict Technique (TCT) is a simple, evidence-based, low-cost method of proactively collecting observational data to evaluate the safety of intersections and stretches of roadways before and after a road safety improvement is made.
TCTs can help decision makers select and evaluate the most effective strategies for improving road safety and preventing injuries. TCTs involve counting and studying traffic conflicts and are particularly helpful in locations where data are scarce.
Using the TCT Toolkit in school zones
Since children regularly travel within school zones, the Toolkit specifically focuses on traffic conflicts between student pedestrians and cyclists and cars, buses, motorized 2- and 3-wheelers, etc. occurring in and around school zones in low- and middle-income countries. These types of traffic conflicts are referred to as pedestrian-vehicle conflicts.
The TCT Toolkit has been developed by the National Foundation for the Centers for Disease Control and Prevention (CDC Foundation) in partnership with the FIA Foundation. It is a comprehensive guide designed for anyone interested in improving road safety. It describes five different methods previously developed by road safety experts to evaluate the impact of a road safety intervention by collecting and analyzing traffic conflict data and focuses on preventing crashes and injuries among children on their way to and from school.
Steps involved in TCT
The process begins with assessing existing road user risk and then progresses to collecting and analyzing traffic conflict data to inform the selection and implementation of the road safety intervention(s). Using the pedestrian-vehicle data collection methods, traffic conflict data are collected both before (pre-intervention) and after (post-intervention) the implementation of the road safety intervention(s). Comparing the pre- and post-intervention data is useful to evaluate whether the intervention is effective in reducing traffic conflicts, and thus, reducing potential crashes, injuries and deaths.
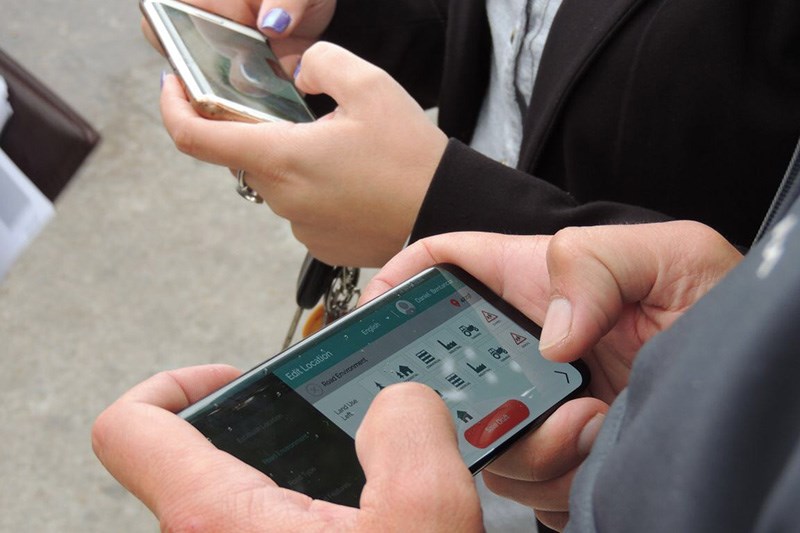
In collaboration with Bernard van Leer’s Urban95 program, Gehl has developed tools to better understand the experience of small children (ages 0-5) and their caregivers in the built environment. The Urban95 program aims to create healthy, prosperous, and vibrant cities where babies, toddlers and their families can thrive. This initiative is meant to make lasting change in the urban landscape and provide opportunities that can shape the first five years of a child’s life. The tools presented in this guide are an adaptation of the Gehl tools but tailored to small children and their caregivers. Following this mindset, the guide assumes that by focusing on the urban realm’s most vulnerable users we can better build cities that are good for everyone.
Below is an overview of the tools in this guide. Please visit the guide for more details. The guide contains directions and worksheets for each tool.
The People Moving Count tool records people moving through an area at a given time. It allows us to understand who is moving through and their form of mobility.
The Stationary Activity Mapping tool observes what kinds of stationary activities are happening in a place. It allows us to understand who is present and how a place invites for different uses.
The Urban95 Quality Criteria tool assesses specific urban qualities from the perspective of caregivers and young children. It is an informative discussion tool that allows us to highlight central characteristics of a public space for human well-being.
The Intercept Survey tool captures information about why caretakers and their children are spending time in a place. This allows us to gain deeper insight into what the other survey tools uncover.
The Sensory Mapping maps how children’s senses can be used in the built environment. It allows us to gain knowledge on what environmental prompts can be stimulating for small children 0–5.
Contains excerpts from Bernard van Leer Foundation document
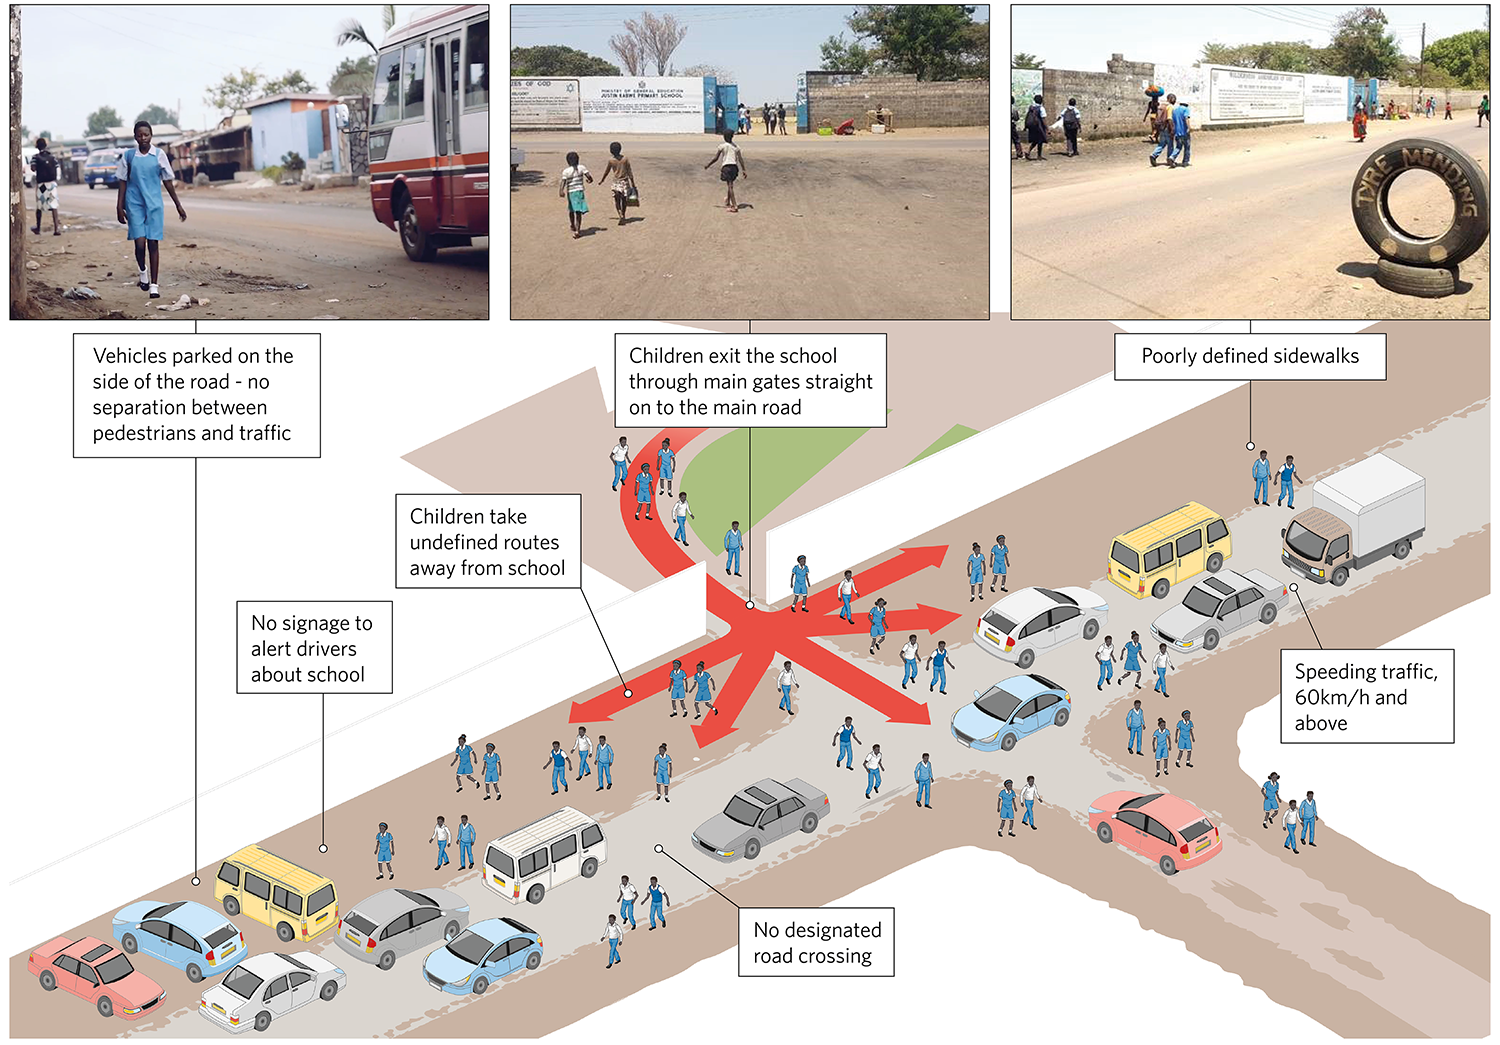
Amend, with a local NGO partner and local engineer, worked in collaboration with the Mayor of Lusaka's office to implement road safety infrastructure improvements around Justin Kabwe Primary Schools in Lusaka. The school has a population of 3,220 pupils and four road traffic injuries amongst pupils were reported among the student population in the last year. The road in front of the school is quite busy with vehicular traffic.
A road safety situation assessment carried out before any improvements were done revealed that an average of 652 vehicles per hour use the road in the morning peak hour when children are going to school. At school opening times, 215 pedestrians per hour cross the road in front of the school (of which 135 are pupils of Justin Kabwe Primary School). 1,610 pedestrians per hour were found to walk along the road in front of the school (of which 1,304 were pupils of Justin Kabwe) during this same time.
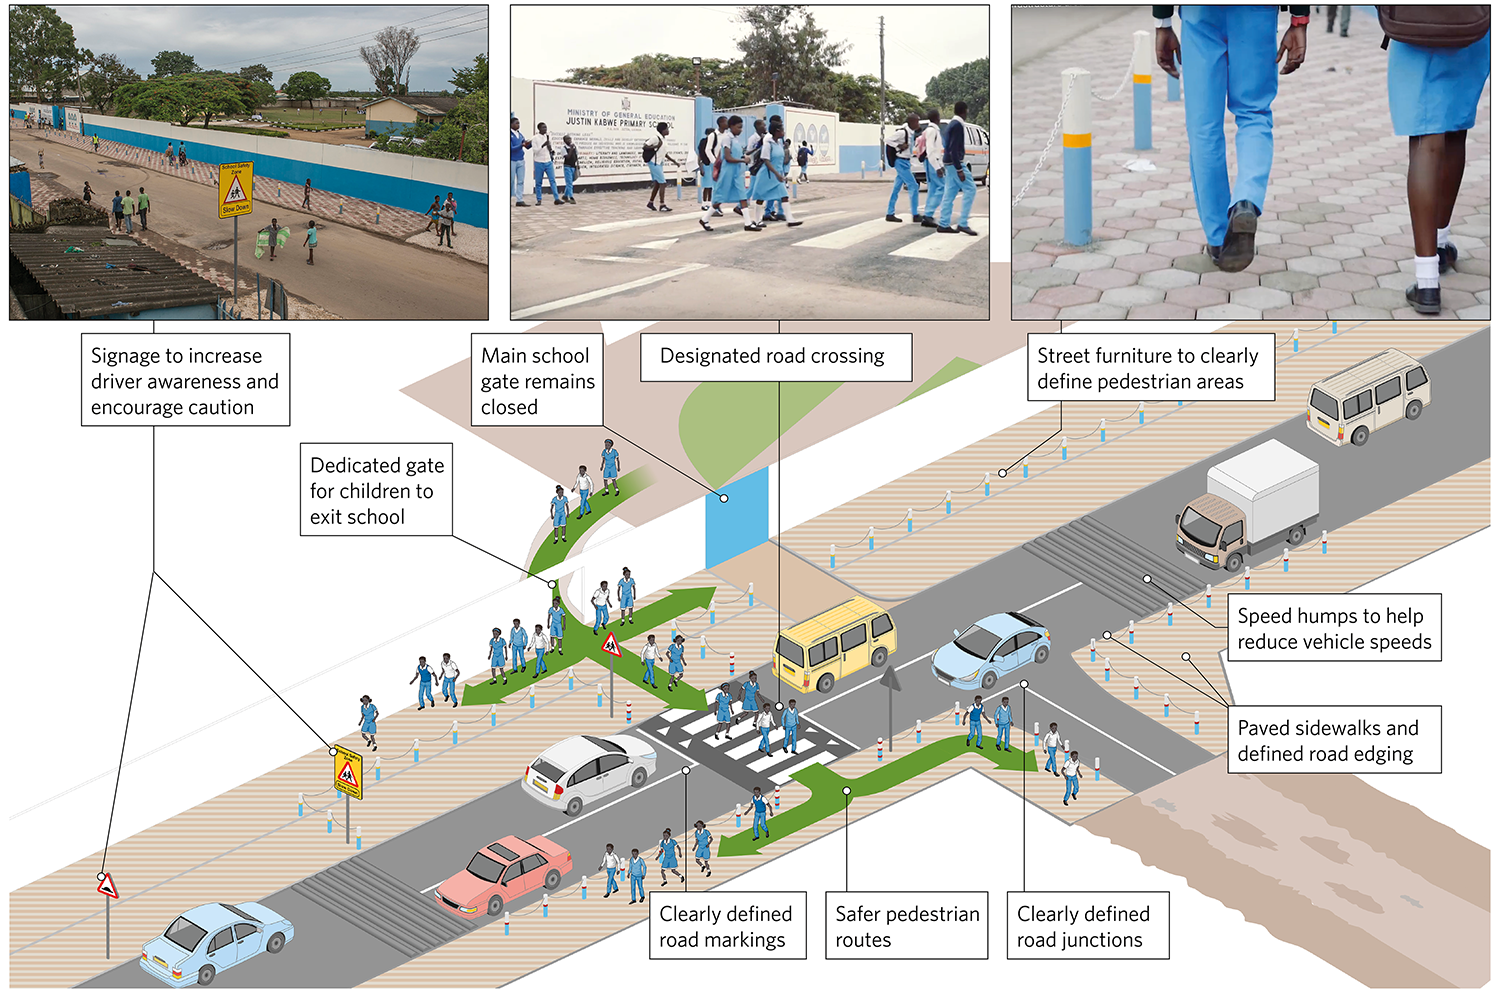
Following the technical assessments of the school area and interviews with children, teachers and the wider community near the school, proposals were designed and put forward to improve the road safety situation around the school. These improvements comprised:
Road Safety education was also administered to all the pupils at the school. The lessons had a theoretical classroom portion and a practical portion carried out in the schoolyard.
Before implementation of the road safety improvements, in the 85% cases speed was above 30km/hr but this dropped by 56% to 14km/hr after implementation, demonstrating a much safer environment for pedestrians.
BEFORE
AFTER
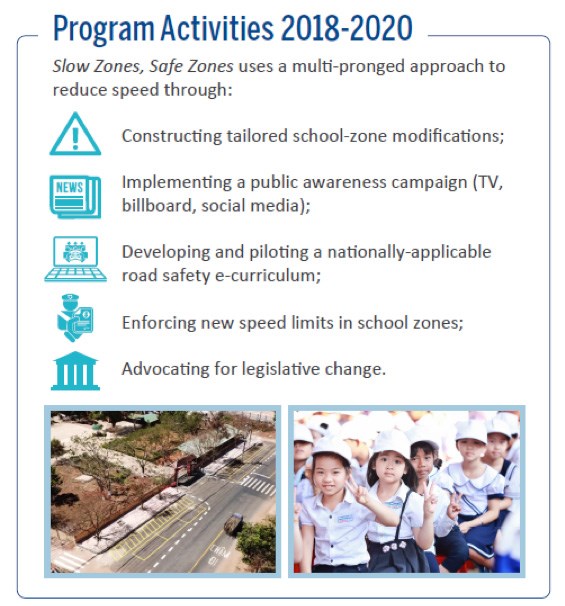
Pilot school zone safety project contributes to legislation on reduced speeds in Vietnamese school zones.
In 2018, AIP Foundation launched its Slow Zones, Safe Zones project to improve school zone safety through targeted speed reduction interventions. Two target schools were chosen based on a selection process that considered road traffic crash figures, commitment of school administrators, and each school’s proximity to high-traffic areas.
Pre-intervention assessments showed that:
Preliminary impacts from the project’s mid-term evaluation in 2019 showed:
Final results from the first phase of Slow Zones, Safe Zones will be made available in 2021. Read more about Slow Zones, Safe Zones here.
![]() CLEAN AIR
CLEAN AIR
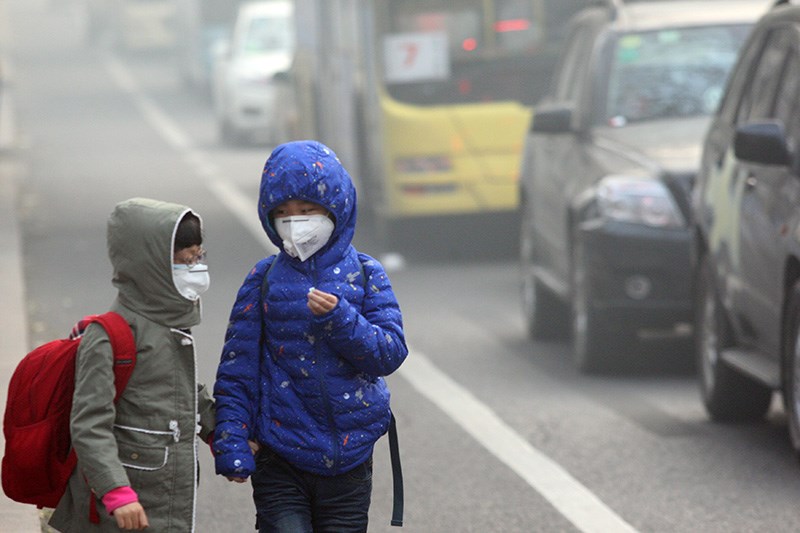
There is limited capacity in developing cities to build databases on air quality levels, emission sources, and health. Likewise, it takes time and resources to establish plans and measures to manage air pollution. This section provides mechanisms to assess air pollution levels for children in cities and specific localities. This information, helps local governments and community leaders manage air pollution and provides fundamental knowledge on the components of a strategic air quality management (AQM) framework. This information is essential in developing evidence-based programs and actions to mitigate impacts of air pollution on school children.
Clean Air Asia developed the Clean Air Scorecard Tool (CAST) to provide an objective assessment of a city’s air quality status, management practices, and policies. The CAST allows city stakeholders to identify AQM areas that can be improved and further guide cities in identifying and prioritizing actions.
The CAST includes three indexes: (i) Air Pollution and Health, (ii) Clean Air Management Capacity, and (iii) Clean Air Policies and Actions.
| Category | Scores |
|---|---|
| Fully Developed | 81-100 |
| Maturing | 61-80 |
| Emerging | 41-60 |
| Developing | 21-40 |
| Underdeveloped | 1-20 |
Each of the three indices consists of relevant questions for which points are allocated. Higher scores indicate better air quality policies and measures. The three indices each contribute a third of the potential points to the an overall Clean Air Score of 100. Cities are then categorized based on their overall score.
To see the detailed assessment and scoring structure please see the CAST information note here.
The CAST generates a report which indicates the results for each of the indexes and sub-indices and the overall score. These show the city’s strengths and weaknesses for the assessment year. The scorecard also generates the following city’s information:
The tool can be used by the following:
Step 1. Identify a focal point from the city environment office. The CAST requires technical inputs from a city official on different aspects of AQM.
Step 2. Identify partners from the academia and civil society. These stakeholders will add credibility to the assessment of the AQM capacity of the city. They will also serve as alternative data providers in case the city environment agency cannot provide information.
Step 3. Undertake the CAST assessment and validate the findings. Organize a validation workshop with different stakeholders to validate the results.
Step 4. Prioritize key AQM areas for immediate project planning. Assess the availability of resources to develop and implement pollution mitigation measures and a Clean Air Action Plan (CAAP). Establish a core working group to oversee the planning process. For example, activate associations within and outside of the school, including parents, community members, and local decisionmakers and involve them in the planning process (see Implementation and Design section).
Step 5. Foster partnerships with other organizations. Collaborate with other organizations and map synergies and opportunities to maximize resources and impacts.
Step 6. Develop a roadmap for air quality improvement. The roadmap will set short, medium, and long-term targets and will define the roles of each stakeholder groups involved.
Step 7. Implement the project and roll out a monitoring and evaluation framework. With support from the local government and collaborators, keep track of the project’s progress and report/disseminate project milestones to a broader audience.
Step 8. Disseminate experience and benchmark good practices on AQM. Utilize the CAST to benchmark AQM good practices to inform scale-up of activities.
To download the Clean Air Scorecard Tool, please click here.
The toolkit was developed for primary schools so that they could gain information and plan activities for their students using citizen science to measure local air pollution.
The toolkit enables educators, local decisionmakers, support staff, and school administrators to:
The toolkit is divided into six sections which are tailored to different users. Each section contains guidance on how to complete activities, ideas, tips, and other resources to support the work.
Section 1: About Air Quality (For educators, local policy- and decisionmakers, and school administrators)
The section’s objective is to equip the user with fundamental knowledge and understanding of air quality, common pollutants and sources, health impacts, and recommendations on reducing emissions at the personal and family level (for students, parents and teachers). The Section sets out a Lesson Plan, activities and worksheets.
Section 2: Linking Cleaner Air 4 Schools to the National Curriculum (For educators)
The section provides an overview of how to deliver the Cleaner Air 4 Primary Schools Programme through the integration of Citizen Science and Social Marketing activities and experiments into a school’s Scheme of Work. It sets out a programme of activities which can be holistically or individually implemented by schools to introduce the air pollution issue to children, to enhance understanding of emission sources, and to introduce mechanisms to affect change. The section provides a guide in planning and implementing a 12-week programme to investigate air quality. Linkages with the National Curriculum through Citizen Science and air quality activities are highlighted.
Section 3: Citizen Science Activities (For educators)
The section provides information on several Citizen Science activities which can be implemented by schools. Resource sheets are provided, including lesson sheets, survey field guides, factsheets, record forms and detailed instructions (including costs) per activity. Guidance on organizing Social Marketing activities such as campaigns are also provided. The section focuses on using findings from investigative Citizen Science activities and identifying the major sources of air pollution around the school (i.e., are vehicles causing more emissions than establishments?), sharing findings and information with the rest of the school and at home, identifying aspects that impact air quality (i.e., school activities, travel plans), incorporating Citizen Science findings into lessons, and tracking impacts of measures and campaigns.
Section 4: Travel Plan Advice (For educators, school administrators, local policy- and decisionmakers)
The section aims to encourage, enable, and empower schools to harness the air quality improvement benefits of strategically planned school trips, to help schools increase and promote sustainable transport for school journeys. The section provides guidance on school travel plans, case studies, and suggested measures at the school and community level to reduce emissions from mobile sources and exposure of children to travel-related air pollutions.
Section 5: Reducing Emissions from School Buildings (For educators, school administrators, local policy- and decisionmakers)
The section aims to identify building-related air pollution emissions. It provides an overview of the typical sources of air pollution from school buildings and provide recommendations to reduce emissions and save on energy costs from school operations.
Section 6: Reducing Exposure to Pollution in School (For school administrators, local policy- and decisionmakers)
The section provides information and advice on reducing the exposure of staff and students to poor air quality. It provides measures and recommendations to reduce exposure of school stakeholders from mobile emissions (e.g., setting Low Emission Zones within the school vicinity), programs to increase carbon capture (e.g., school greening), provision of infrastructure for emission control, and raising awareness to change stakeholder behavior (e.g., promoting non-motorized transport for use in school journeys).
The Cleaner Air 4 Schools Toolkit can be downloaded here.
In London, the Mayor has designed a comprehensive process to assess ways to reduce emissions and exposure to air pollution in and around schools in the city. It includes ideas like:
moving school entrances and play areas away from busy roads
'no engine idling' schemes to reduce emissions from the school run
local road changes including better road layouts, restricting the most polluting vehicles around schools and pedestrianisation by school entrances
adding green infrastructure like ‘barrier bushes’ along busy roads and in playgrounds to help filter fumes
encouraging students to walk and cycle to school along less polluted routes
The Mayor is encouraging London boroughs to audit every school within an area of high pollution, and to develop plans to address the issues.
The toolkit is available here
It has been designed for London, and so could have to be adapted for use in different contexts.
Cleaner Air 4 Schools is an innovative collaboration among schools, led by the London Sustainability Exchange, in partnership with UN Environment and Clean Air Asia, which was coordinated and funded by the FIA Foundation. It uses citizen science - an approach which helps communities build an understanding of the issues they face by engaging them in the collection of evidence - and provides the opportunity for children to build the knowledge and language to express and call for real change. By engaging children about the quality of air that they breathe, they can better understand their world and how to improve it. Learning about the health impacts of air pollution empowers them to become advocates of change with their families, the wider community and even local and national policy makers.
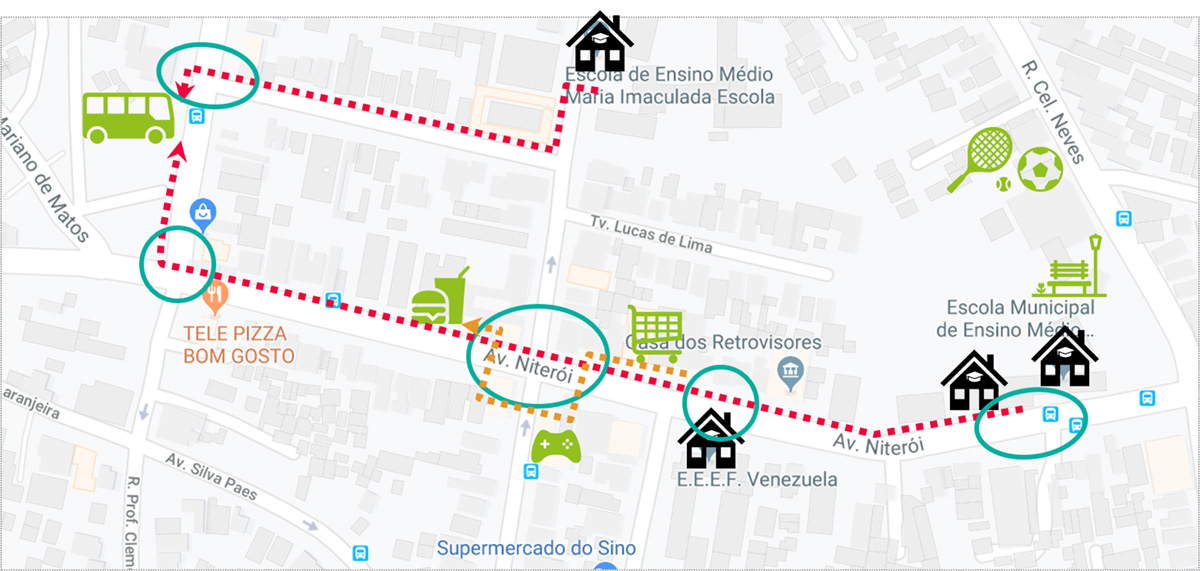
Students from Maharaja Agarsain Public School (MAPS) took part in this pioneering project to understand, monitor and act on air pollution around their schools. Using ‘citizen science’ pupils tested air quality in different locations in and around their school for NO2 as a marker of air pollution using diffusion tubes. They also mapped their current routes to school, the hazards they faced, and how those hazards might best be avoided.
The results show that every test site considered at the school showed NO2 levels well above the WHO guideline levels, including in the playground. NO2 levels were highest at the school entrance, which overlooks a narrow road where there are continuous traffic jams with motorized vehicles. Moreover, roadside test sites had twice as high levels of NO2 compared to WHO guideline limits.
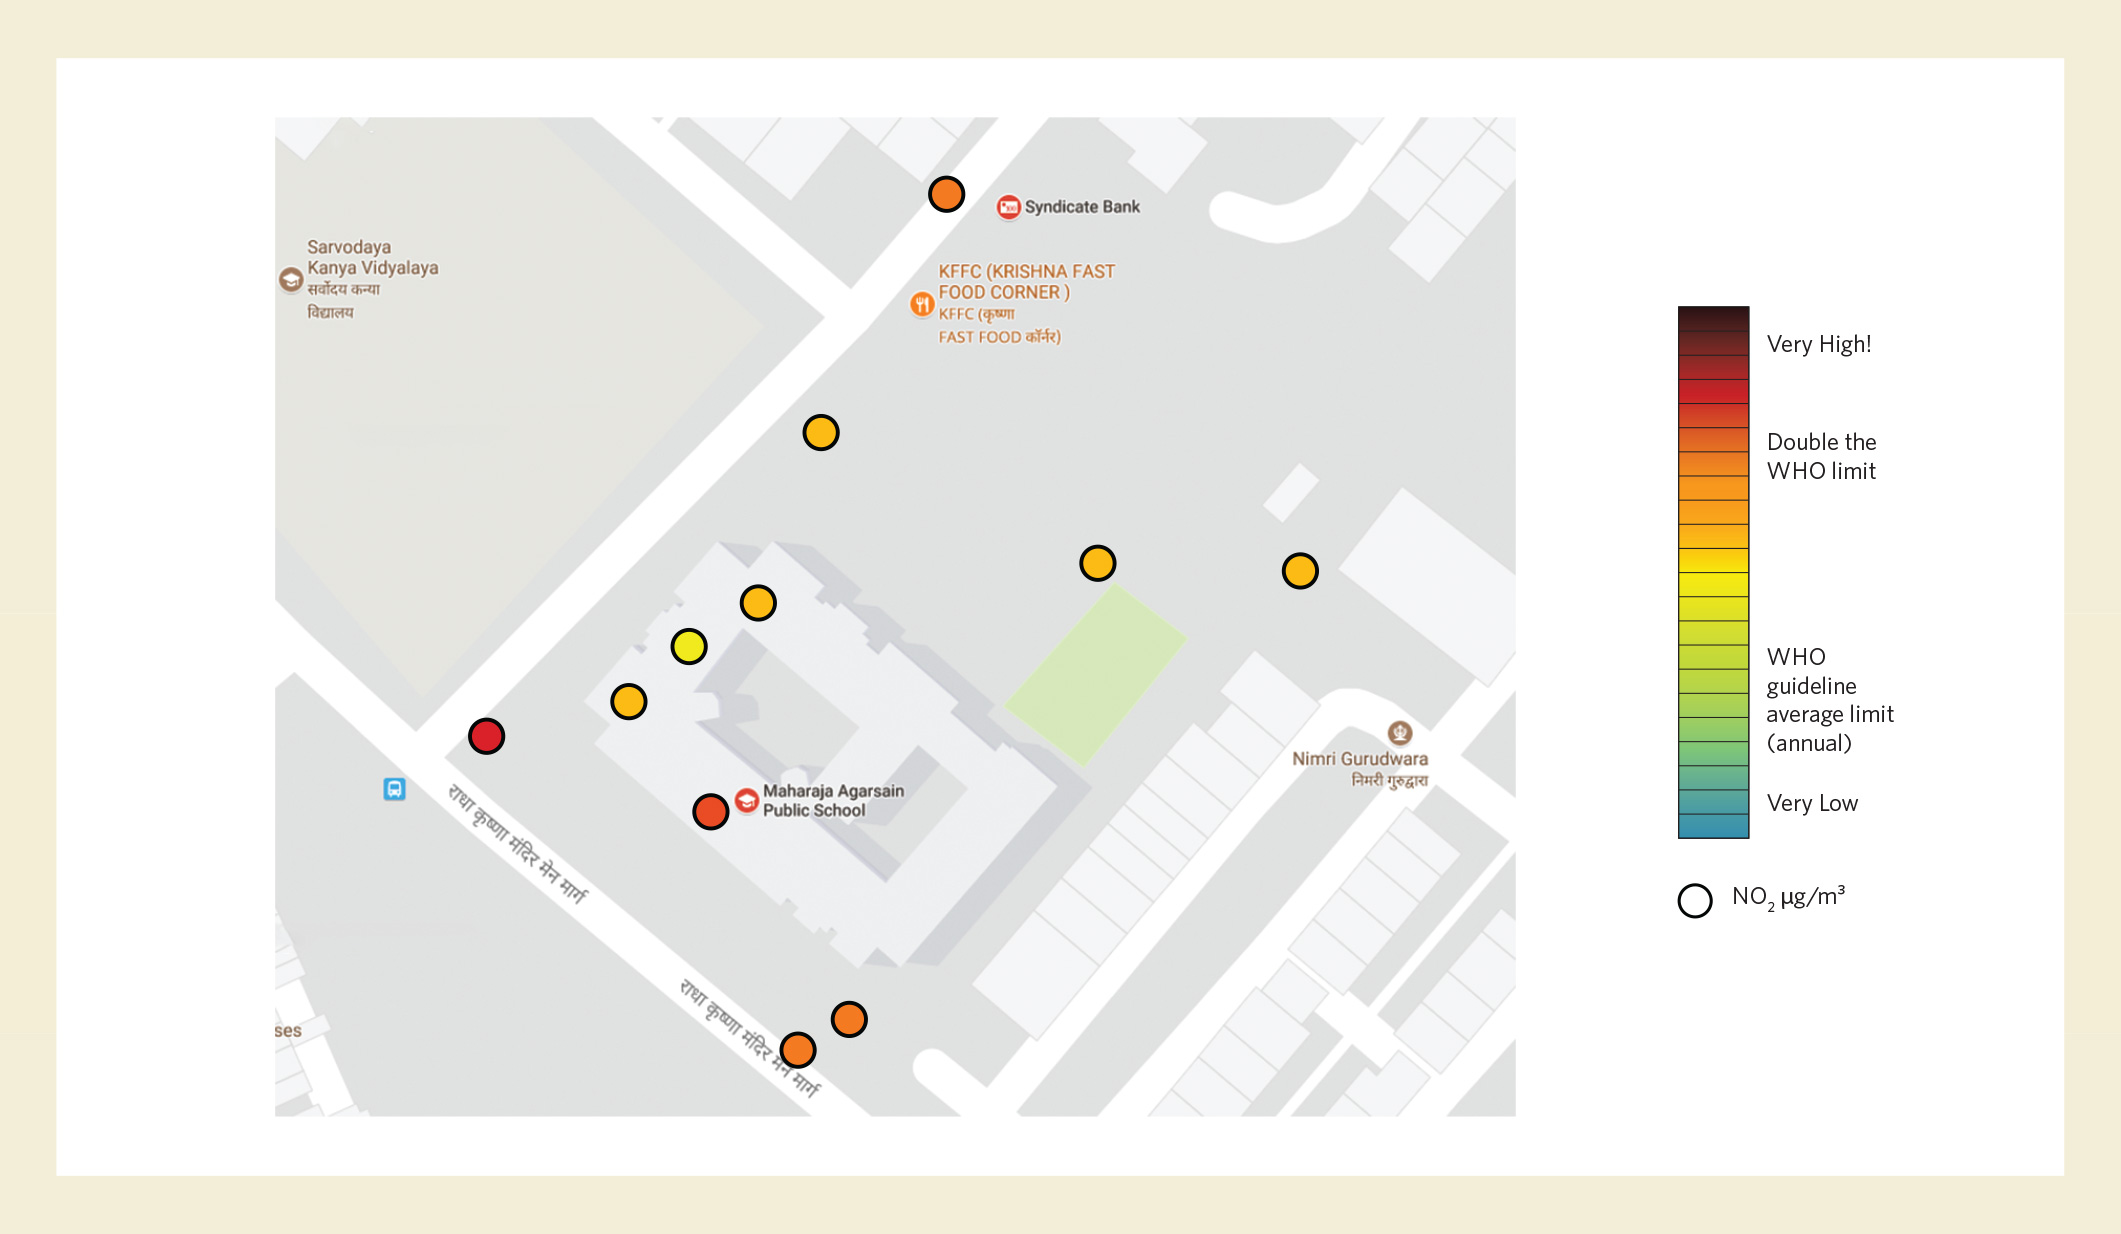
The experience and its findings resulted in an increased awareness and understanding of both the students and parents of Maharaja Agarsain Public School on the quality of air that they have in the school area. The exercise elicited commitment from air quality champions to promote air pollution mitigation measures that will reduce the exposure of school children. These measures include promoting activities such as car sharing, planting trees and non- motorized transport.
Walkit.com is a free UK-based online urban walking route planner which provides a user a desired walking route based on the following options: shortest route, less busy route, or low pollution route. The application provides the user a walking route map that includes the estimated journey time, calories burned, step count and carbon savings.
LAEI (London Atmospheric Emissions Inventory) is a database of geo–referenced datasets of atmospheric emissions sources and information about the location, rates of emissions and estimates of the quantity of specific pollutants emitted into the air within and around the Greater London area. To have a look on how the London Air Quality Database, visit https://data.london.gov.uk/air-quality/
The initiative has worked with UK’s major cities such as London and Cambridge in introducing air pollution-aware routes which lessen individual’s exposure to air pollution. The initiative generated pollution maps based on local air quality data and modelling. Air quality data was collected from existing air quality monitoring stations in the city while emissions data came from local emissions inventories.
With the support from City Councils, pollution maps were generated by overlaying the city’s road and paths with existing air quality data and modelling results. The map uses annual average concentrations of nitrogen dioxide (NO2), a pollutant associated with road traffic and combustion sources. For the London project, the pollution maps are based on air quality modelling produced by the Greater London Authority (GLA) using information contained in their London Atmospheric Emissions Inventory 2003 (LAEI 2003). Cambridge used its annual average NO2 dataset (baseline year of 2005).
Using pollution-aware maps, users can opt to take “low pollution” walking routes to their destination. These are routes with the least average NO2 concentrations and hence, least exposure for pedestrians along the entire path segment or length. The map will also give estimates of calories burned and carbon dioxide footprint saved by taking the said route. By taking a route, users can contribute on enhancing the map’s footpath data by providing “walking knowledge” where their feedback on the routes are collated to update the pollution-aware maps. Each of the route’s journey detail is recorded and displayed on the webpage as reference for future users.
To support the project, a free SMS-alert service, airTEXT, which disseminated air pollution information in the city was launched in London. Students, parents, and school administrators can subscribe to this service to be informed of the daily air quality bulletins which can help in minimizing their exposure to air.