
Scaling up impact
Securing financial sustainability and long-term commitment of your safe and sustainable mobility program.
Introduction
Often a project may start with a pilot or an intervention in one community. It is important to evaluate the impact to test whether the approach is effective. To achieve wider change, it is important to scale-up successful interventions that can be replicated elsewhere.
What evidence do donors and international development agencies want to see before they will fund larger projects? How can commitment and ongoing funding be secured with public authorities?
Safe Streets
This section provides guidance on how successful projects and their results can be sustained over the longer term and how to scale them up. It explains how to use findings and results from current projects to engage with new donors and generate interest of public authorities. This section also introduces a Health Impact Assessment typically used to assess the potential health effects of interventions.
Safe Streets Tools
HEALTH IMPACT ASSESSMENTS
In public health, Health Impact Assessments are a combination of procedures, methods and tools which are used to evaluate the health effects of a programme, project, or policy.
These include qualitative, quantitative and participatory techniques which generate recommendations that will help the project implementer, decision- and policy-makers and/or other stakeholders make choices about whether to make any modifications to the programme.
They can also inform decision-makers and partners on whether (and how) the programme can be scaled up. To read a Health Impact Assessment conducted on a Safe Routes to Schools progamme in the United Kingdom click here.
THE GLOBAL CASE FOR SAFE AND HEALTHY JOURNEYS TO SCHOOL

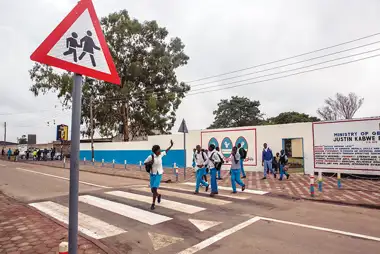
Every child deserves a safe and healthy journey to school. It is a fundamental right. And yet, every four minutes a child is lost on our roads. Millions more are injured in road traffic crashes or their lungs are damaged by the effects of urban outdoor air pollution. Addressing road traffic is complex and dangerous, and children are especially vulnerable.
Many children do not have the option to walk or cycle to school because it is too unsafe. There are no footpaths, roads don’t have lights, or vehicle speeds are too high for them to reach their school, their education, their future, safely and in comfort.
Focusing on schools as an intervention site for road safety has far-reaching effects, not just on students, but on whole communities and ultimately cities. Simple evidence-based interventions, such as those in this toolkit, prevent deaths and injuries from not only dangerous roads and polluted air, but also through the cumulative positive effects of walking and cycling on physical activity, ultimately reducing noncommunicable diseases. Promoting this approach is a key policy objective for Child Health Initiative, comprising key international agencies, donors and research partners.
SOCIAL AND ECONOMIC IMPACTS
More than 500 children die on the world’s roads every day, almost half of them as pedestrians, cyclists and motorcyclists. For their parents, siblings and extended families, there are life-long social and financial consequences, but the pain and suffering that they endure cannot be quantified. Most of these children are from less-resourced settings already struggling with triple burdens – communicable, noncommunicable diseases and injuries.
Prasad's story
On 26 December 1996, Prasad left home early in the morning to go to school. He only ate one chapati before leaving, assuring his mother that he would eat more when he returned. Before he left, he asked his sister for some money to buy a greeting card for her soon to be husband. He cycled to school safely that morning, but never made it back. A speeding tanker lorry hit him, throwing him off his bicycle and into the road. He sustained a head injury and lost consciousness. The driver tried to escape – he had previously killed two people in crashes. Two college student witnesses chased him down and brought him to the police, before returning to the scene to search Prasad’s schoolbag and find out what school he attended. They contacted the principal, who took the unconscious boy to the hospital.
The students found his parents and delivered the tragic news. By nightfall, Prasad’s parents went to the hospital to see him lying unconscious in a hospital bed. The doctors said they did not know if Prasad would live. The next day, his condition deteriorated and he was hooked up to an oxygen tank.
Towards the evening, Prasad took his last breath. He would no longer eat the chapattis his family prepared for him. He would not post the greeting card to his soon to be brother in law. His family said that his name was misprinted in the newspaper as Prakash (light), but his death plunged them further into gloom and darkness.
Adapted from Faces behind the figures. Voices of road victims and their families. WHO, 2007
The World Bank estimates crashes to cost as much as 7% of a country’s Gross Domestic Product in some regions, and a global economic loss of close to 2 trillion dollars every year. The World Health Organization (2018) found that this disproportionally hurts low- and middle-income countries; these countries have approximately 60% of the world’s vehicles but account for 93% of road crash fatalities, generating an economic loss of 3-6% of countries’ GDP in lost labor, healthcare costs, and pain and suffering. Despite high level policy instruments and global leadership, there has been little action.
The tide may be turning. Recently, World Bank President Dr Jim Kim called for more attention to air pollution and transportation as part of a Human Capital approach emphasising education and health services above infrastructure investment. He wrote “Countries with large gaps in human capital need to radically rethink how they are preparing their people for what lies ahead. Countries need a range of investments that improve outcomes, including clean air and water, safe transportation to get children to school, health clinics, and social protection to ensure that no one is left behind.” This approach, with policies that put people first, is fully endorsed by the Child Health Initiative.
Links
Read 'The Cost of Inaction: Can We Afford Not to Invest in Road Safety?'
Read 'Human Capital approach should target safe journeys to school, says World Bank chief'
See how storytelling and data assessment proved value in AIP Foundation’s Cambodia Helmet Vaccine Initiative Report
AIP Foundation’s evaluation report of the Vietnam National Child Helmet Action Plan
AIP Foundation’s infographic of the Vietnam National Child Helmet Action Plan results
EXISTING DONOR INITIATIVES
The UN’s ‘Every Women, Every Child’ (EWEC) initiative, launched in 2010, aims to provide a framework and roadmap for efforts to end preventable deaths among women, children, and adolescents. Its Global Strategy for the SDGs, published in 2015, builds on the focus and achievements of the Millennium Development Goals with an emphasis on continuing collaborative responses to tackle leading killers of expectant mothers, newborns and the under-fives, as well as HIV/AIDS, Malaria, Tuberculosis and neglected tropical diseases.
This vision has succeeded in marshalling funding pledges for the EWEC Global Strategy of at least US$ 28.4 billion, with lower-middle-income countries pledging an estimated US$ 8.5 billion of the total. The Global Financing Facility in Support of Every Woman, Every Child100, launched at the 2015 Addis Ababa Financing for Development Conference, plays a coordinating role, helping governments to focus strategies, find donor and implementation partners and design reforms of domestic health financing.
Yet little of this funding and effort has been allocated to improving air quality, indoor or outdoor, and none to tackling the leading killer of adolescents: road traffic injury.
According to a recent study on the case for investing in adolescent health in the Lancet, “an investment of less than $1·0 per capita each year in the prevention of road traffic injury would reduce deaths and serious disability by about 30%”. It went on to show that for interventions targeting road traffic injuries, a benefit-cost ratio of 5·9 (95% CI 5·8–6·0) was achieved on investments of just $0·6 per capita each year.
In Tanzania for example, Amend, with support from the FIA Foundation, demonstrated that focusing relatively low cost infrastructure improvements on schools with the highest road traffic injury rates prevents one road traffic injury for every 286 at-risk children, reducing injury rates by at least a quarter, and serious head injuries by half.
Further evidence that investing in road safety makes good economic sense comes from the World Bank. According to their new report, road traffic crashes are the single largest cause of death among young people (15-29 years) and halving their death and injury rate could lead to long-term GDP increases of up to 22% in some countries. The President of the World Bank, Dr Jim Yong Kim, encouraged action at all levels to address the issue.
Private sector and philanthropic support for civil society is vital to develop and sustain advocacy voices within countries and across the region, and to support the demonstration projects which provide the evidence to fuel larger scale investment.

This strong evidence has led donors like Michael Bloomberg to invest $259 million over the last 12 years to implement proven interventions in some LMICs. The Bloomberg Philanthropies Initiative for Global Road Safety, while not focusing specifically on children and adolescents, implements five proven interventions to reduce child injuries:
- Changing behaviours
- Improving infrastructure
- Promoting sustainable urban transport
- Improving vehicle standards
- Strengthening policies
The Fondation Botnar has also been led by the evidence to invest in child and adolescent health, by recently announcing the Botnar Challenge, led by the Global Road Safety Partnership. The Challenge supports road safety projects from consortiums representing partners from government, civil society and the private sector impact children in India, Mexico, Romania, South Africa, Tunisia and Vietnam.
According to the UNECE Executive Secretary, Olga Algeyerova, “Transforming the global road safety situation, which represents 1.25 million deaths and an estimated economic cost of $1.85 trillion every year, urgently requires the strengthened involvement of a wide range of partners and the enhanced coordination of global efforts”. As she launched the UN Road Safety Trust Fund in August 2018, she said the fund was another important step in the right direction.
These are positive examples of the contribution being made by donors. But significantly more funding is needed, from private sector, philanthropic and bilateral sources if civil society is to be sufficiently strengthened to meet the challenge of the Sustainable Development Goals.
Links
See the 'Every Woman Every Child' website
Read 'The Cost of Inaction: Can We Afford Not to Invest in Road Safety?'
Read 'Building the foundations for sustainable development: a case for global investment in the capabilities of adolescents'
Read the Bloomberg Philanthropies approach to Global Road Safety
Read about the Botnar Child Road Safety Challenge
Read 'Launch of United Nations Road Safety Trust Fund'
THE CHILD HEALTH INITIATIVE’S APPROACH
The Child Health Initiative was launched in 2016 because nobody in the corridors of power was fighting for children’s rights to mobility. We’ve embraced the “Nothing about us without us” ethos by listening to children and young adults, meeting them in their streets and their schools, working with them to develop new advocacy tools to demand safe streets and clean air.
When developing a strategy for a safe journey to school in your city, it is important to understand the risks that may be found around schools. These are some of the common risks that should be taken into account:
| Area of road safety | Specific road safety risk |
|---|---|
| The road environment | High speed traffic Traffic overtaking outside school Unsafe parking / drop off zones Unsafe/non-existent crossing facilities No sidewalks or cluttered/unsafe sidewalks Unsafe intersections Other unsafe infrastructure issues on the walk to school |
| The school environment | Inadequate or poorly designed drop off/parking zones leading to conflict between cars & pedestrians Lack of sidewalks, pathways, cycle paths School may be on opposite side of a busy highway School may be hidden from drivers view (esp rural schools) |
| Road users | Lack of (or inadequate) school policy Drivers not obeying road rules, e.g. speeding, overtaking, etc Drivers not paying attention to children around school Children not crossing at designated site No supervision of children |
| Bus safety | Motorists passing a stationary bus with children getting on and off Motorists not obeying speed limits Unsafe pedestrian activity to and from school buses Buses stopping at unsafe locations |
Adapted from: Safer Journeys for schools: guidelines for school communities, NZ Transport Agency, 2017.
Ten strategies to keep children safe in traffic
- Control speed
- Reduce drinking and driving
- Wear helmets
- Use appropriate child restraints
- Improve children’s ability to see and be seen
- Enhance road infrastructure
- Adapt vehicle design
- Reduce risks for young, novice drivers
- Provide appropriate care for injured children
- Supervise children on the roads
Source: 'Ten strategies for keeping children safe on the road' report
Your strategy should embrace the safe systems approach – it should not just focus on the child as a road user – and it should include a door-to-door experience for the school child, not just focusing on the school area alone.
As you develop your strategy for a safe journey to school in your city, bear in mind these 10 evidence-based interventions which we know will keep children safe on their route to school whether they are walking, cycling or being transported in a vehicle.
Ask yourself the following questions:
- Road Users:
- What initiatives can improve the road behaviour of parents, teachers and children?
- Put in place a good school policy
- Visible enforcement around the school (get the police involved)
- Offer appropriate road safety education to children, teachers and parents
- What initiatives can improve the road behaviour of parents, teachers and children?
- Roads:
- What infrastructural changes can be made around the school that will encourage better driver behaviour and make the walk to school safer for children?
- How can pedestrian behaviour be improved?
- Better signage around schools including warning signs (children crossing)
- Reduction of speed around schools
- Variable – speed is limited only when the speed warning lights are flashing
- Static – speed reduction around school is permanent
- Other infrastructural changes such as:
- road narrowing or chicanes
- zebra crossings which are supervised
- improved sidewalks
- good/clear road markings
- overpasses or underpasses if the school is on the other side of a busy road/highway
- Vehicles
- What can be done to make children safer inside cars, motorcycles, buses as well as when they get out of these vehicles to go into school?
- Use appropriate child restraints
- Wear helmets
- Supervised crossing the road
- Walking buses supervised by adults
- Well-designed parking and drop-off zones
- What can be done to make children safer inside cars, motorcycles, buses as well as when they get out of these vehicles to go into school?
CASE STUDY
Child helmets in Vietnam
In 2010, Vietnam passed legislation explicitly mandating child helmet use for children aged six years and older. One year later, only 18% of children in Hanoi, Danang, and Ho Chi Minh City were wearing helmets on motorcycles. Why?
To address the problem, the AIP Foundation designed and implemented a comprehensive advocacy campaign to increase helmet wearing rates and protect children by improving enforcement. Throughout the campaign, ongoing research, monitoring, and evaluation was conducted, so that it could be tweaked accordingly along the way.
The campaign was developed using quantitative and qualitative methods. Researchers from Vietnam National University conducted an in-depth baseline study to identify factors that affect child helmet wearing rates, including motivations and barriers to wearing a helmet, the road safety environment, and other social factors. They conducted school observations in randomly selected districts in three major cities. The rates served as the baseline wearing rates against which the campaign's efficacy was measured at the end of the project. In addition to helmet use observations, the research team also conducted interviews and focus groups with parents, teachers, school administrators, and students to better understand why child helmets were or were not being used. These key findings were used to develop a campaign strategy and to design and set targets for the project.
Engagement with the police and other authorities was essential. Meetings and workshops with police revealed that a lack of human resources and competing financial priorities were a key reason for the lack of enforcement of child helmet use. Other reasons included the social difficulty of giving fines to parents when the child helmet law was so unpopular, coupled with children becoming distressed (about being late) if they were fined on their way to school. Realizing how effective police enforcement was in raising the adult helmet wearing rate, the AIP Foundation and partners concluded that enhanced police enforcement, alongside better in-school enforcement and policies, would be a necessary and complementary component of the child helmet campaign.
In addition to the baseline study, AIP Foundation and partners conducted ongoing monitoring, evaluation, and research throughout each of the three phases of the integrated campaign. Through a pilot approach, each campaign component was implemented on a small scale in one phase, evaluated and adjusted, then scaled up in the following phase. For example, enhanced police enforcement was piloted in select districts of Ho Chi Minh City during phase one, before scaling up to all three target cities in phase two. This enabled the advocacy campaign to present results of success in enforcement activities as a rationale for a further scaled-up response.
Implementing the police enforcement component of the campaign provided valuable insight to campaign partners. Importantly, campaign partners noticed that targeting specific districts had positive spillover effects into other districts. Enhanced police enforcement was conducted in pre-selected areas in the target cities, but the coordination of the police forces at the district and provincial level made it possible for other districts and provinces to learn about and implement the campaign's successful enforcement strategies.
The most critical component of the campaign, in terms of long-term impact, was the commitment to building a strong network of road safety partners in Vietnam to support and sustain the child helmet campaign. These partners – which now include multiple government agencies, NGOs, international organizations, research bodies, and private sector organizations – brought a diverse range of resources, skills, and perspectives to the campaign. By the final phase of the campaign, the partnership was committed to continuing the campaign components in the target cities, in addition to expanding the campaign to other provinces in Vietnam.
The campaign team focused on four key indicators to determine the success of the public awareness campaign (PAC): campaign exposure, knowledge change, attitude change, and behaviour change.
Campaign exposure was measured by assessing the extent to which the target groups (namely, parents, students, and members of the school community) saw and recalled the key messages of the PAC materials. For example, the PAC evaluation measured how many parents remembered the campaign message that “Children also need a helmet.” Knowledge change was the first component: the public awareness campaign measured by assessing the increase in awareness among parents and adult supervisors about the mandatory child helmet law. Attitude change was measured by assessing the perceived value of child helmets, and behaviour change was measured through direct observation of child helmet wearing rates in the target cities (noting that police and school enforcement also played a role in behaviour change).
Other measurements of success were also used to help the campaign team and partners evaluate and adjust the PAC throughout the three phases. The PAC incorporated a variety of communication activities, including direct communication to the target group, mass media communication, and digital media communication, all focused on promoting child helmet use.
Direct communication activities implemented throughout the campaign included:
- Distribution of educational materials to primary students and parents such as notebooks and hand fans that addressed the child helmet myths uncovered in the baseline study. These materials also provided information about the child helmet law and reminders to wear a helmet.
- Interactive informational sessions at schools for students, parents, and the school community in the target cities.
- Letters to parents asking for their commitment to always put a helmet on their children.
- Audio broadcasts at school gates aired during school dismissal hours to remind students and parents to wear a helmet on a motorcycle.
These direct communication activities served to emphasize the campaign’s key messages to students, teachers, school administrators, and parents. In addition, direct incentives were provided to the target group, such as the provision of free helmets to select students and the distribution of helmet discount vouchers redeemable at high-quality helmet shops, to further encourage child helmet use.
The evaluation of the PAC showed positive and encouraging results. Of people surveyed at the end of the third phase of the campaign, 94 percent of respondents across Hanoi, Danang, and Ho Chi Minh City reported having heard about or seen components of the PAC. Among those exposed to the campaign in the three target cities, 88% recalled the campaign’s key message: “Children also need a helmet.” Among those surveyed in the target cities, 96% believed that it is necessary for children to wear a helmet when on a motorcycle, compared to only 87% in the baseline. Further, the number of respondents who believe that a helmet is actually harmful for a child reduced from 33% in the baseline study to 10% by the end of phase three.
In defining the most effective channels for campaign communications, the campaign team found a mix of media to be most effective, from billboards through to TV and radio, and social media. Social media was found to be effective, in reaching a wide audience. Social media outlets including Facebook, Twitter, and others proved highly complementary in spreading the campaign messages to thousands of parents throughout the target areas and beyond, at minimal cost. For example, the campaign’s “Children also need a helmet” Facebook page received more than 34,000 followers, and nearly 10,000 parents signed an online pledge to always put a helmet on their child.
Read 'Head First: A Case Study of Vietnam's Motorcycle Helmet Campaign' report
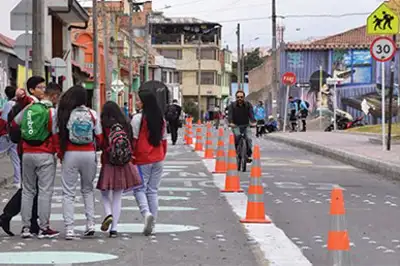
Governing from a child’s perspective in Recife, Brazil
Bernard van Leer Foundation’s Urban 95 initiative has documented the effects of transportation on early childhood development (link contains further case studies). Their in-depth case studies illuminate the connections between transportation and other sectors like health and education in improving the lives of babies, toddlers and caregivers. They show how initiatives can be taken to scale.
This case study about Recife, Brazil, shows how mayor Geraldo Julio prioritized children in his efforts to improve the lives of his citizens in many ways, including mobility. Ranked as the world’s 22nd most dangerous city, rife with poverty and poor health outcomes, the city proved that starting with efforts targeted at children in the most inequitable places can make a difference for everyone.
Efforts began with the Iputinga neighborhood, one of the poorest in the city, and the eighth most violent, with a large concentration of schools and youth. Centered on two schools, a day care center, and a health care center, the project had three main elements: safe play space through two plazas with seating, greenery, and recreational equipment where young children could play and parents could engage in programs on early childhood development; improved sidewalks and streets crossings linking the schools to the plazas; and a public relations campaign to promote the concept and important of early childhood development. A 300 square meter child priority zone included widened sidewalks, stair rails, stop signs, and community gardens.
In Alto Santa Terezinha, empty space was converted into a plaza for young children, and a walkway connecting the center to the community’s main bus stop was renovated with handrails, street lighting, and a raised crossing to increase safety and mobility for pedestrians navigating the busy street.
These changes were only some of many, beyond mobility, created hand-in-hand with the community. They prove that with the right leadership and community buy-in, and a comprehensive approach that includes mobility and linked sectors, low-resource areas can overall improve quality of life for caregivers and children. These changes improve the lives of the entire community.
Read Governing from a child’s perspective: Recife, Brazil works to become family friendly
Contains excerpts from Bernard van Leer Foundation document
Reconstructing a city in the interests of its children in Tirana, Albania
Bernard van Leer Foundation’s Urban 95 initiative has documented the effects of transportation on early childhood development (link contains further case studies). Their in-depth case studies illuminate the connections between transportation and other sectors like health and education in improving the lives of babies, toddlers and caregivers. They show how initiatives can be taken to scale.
Tirana, Albania faced unchecked construction and traffic, threating the health and wellbeing of its citizens, particularly the youngest and most vulnerable. When Erion Veliaj became mayor in 2015, he sought to prioritize children. Protecting children meant addressing air pollution, unsafe streets, and shortages of public parks, playgrounds, and schools
Veliaj’s success stemmed from re-envisioning his city from the perspective of children, the core of Urban 95’s efforts. Schools would serve as an anchor for ITCNs (infant, toddler, and caregiver-friendly neighborhoods) to serve infants, toddlers, and caregivers. Each ITCN would encompass the area within a 300-meter radius of a primary school—the distance an average toddler and caregiver could walk in 20 minutes. Within that zone, city planners would redesign streetscapes to suit ITCN needs for stability, safety, health, engagement, and emotional attachment.
Key design elements included sidewalks, crosswalks, benches, greenery, play areas, signage, traffic calming, and noise abatement. The city would encourage related services like nurseries, health clinics, and fresh-food markets to cluster in the area as well. In less-densely-populated outlying areas, the city extended ITCNs to 500-meter radii. Monitoring and evaluation included measurements of vehicular traffic and air pollution, the presence of supportive services like clinics and nurseries, areas of adequate and unobstructed sidewalks, walking distances between resting points, numbers of trees and streetlights, street noise, density of parks and green space, and maintenance of facilities.
To expand public space and reduce air pollution, noise, traffic, and vehicle crashes, City Hall implemented walking and cycling initiatives to decrease car dependence. To address public opposition, they held public hearings across the city, and hosted the redesign plan on Google docs so people could leave comments and questions for the main architect. When the Mayor received public pushback for plans to turn the largest traffic circle in southeastern Europe into a pedestrianized central plaza, he turned to the children of the city who were already excited by the new parks and playgrounds to advocate for change. He proposed a car-free day where children were invited to play. Children raved to their parents about how much fun they’d had playing in the plaza. Veliaj said, “By that evening, we had won . . . a 20-year-old debate about turning downtown Skanderbeg Square from a place that saw 120,000 cars a day [into a place that] sees more than 120,000 people a day.”
With support from local and international donors and experts—as well as local caregivers—the mayor’s vision for a child-friendly city had disseminated across city hall. And as more and more city workers adopted and included a child’s perspective in their projects and policies, they built a legacy that could outlast the mayor
Read Reconstructing a city in the interests of its children in Tirana, Albania
Contains excerpts from Bernard van Leer Foundation document
Clean Air
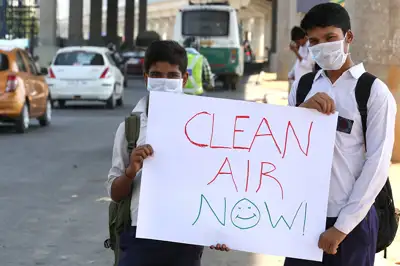
In schools and their immediate vicinity, analysing the impact of air pollution control measures is critical in improving the effectiveness of air quality management (AQM). Conducting Health Impact Assessments (HIA) in AQM initiatives involving schools and school children is paramount.
This toolkit presents some HIA tools and case studies to share lessons and successes gained from conducting an HIA.
Clean Air Tools
HEALTH IMPACT ASSESSMENT
In air quality management (AQM), Health Impacts Assessment (HIA) is a process of assessing to what extent an event, scenario, intervention, or control measure related to air pollution affects the health of stakeholders, including vulnerable members of the population. The scope of the assessment may cover an individual, group, or a community. Health impacts assessment helps AQM policy and decision making by providing information on possible future health problems due to current or projected air quality. Conducting HIAs contributes to an effective clean air action plan (See Implementation and Design section), which will inform the development of policies, strategies, and programs for improved air quality.
While HIAs directly involve medical and public health experts, local policy and decision makers and other city stakeholders must also be familiar with the process to properly inform the development of policies and programs aimed at protecting public health from air pollution impacts.
Conducting HIAs in AQM initiatives involving schools and school children is paramount. Health impact assessments can be done through various techniques using different tools that make data compilation and analysis more efficient. There is no standard or prescribed tool to use for all, as the tool of choice should match the available resources and the technical capacity of the group who will conduct the assessment. This toolkit presents some HIA tools and case studies to share lessons and successes gained from conducting an HIA.
GUIDANCE FRAMEWORK FOR BETTER AIR QUALITY IN ASIAN CITIES: HEALTH AND OTHER IMPACTS (CLEAN AIR ASIA)
About the Tool
In 2014, the first United Nations Environment Assembly (UNEA) adopted a resolution calling on governments to “formulate action plans and establish and implement nationally determined ambient air quality standards” and “to establish emissions standards for their significant sources of air pollution”. Air pollution was also prominently discussed at the 68th World Health Assembly (WHA) in May 2015, which passed the landmark resolution on “Health and the Environment: Addressing the health impact of air pollution”.
In response to these global calls for action to strengthen the link between regional, national and local initiatives in addressing air pollution and mitigating impacts of climate change, Clean Air Asia developed the Guidance Framework for Better Air Quality in Asian Cities (Guidance Framework). The development of the Guidance Framework is a result of discussions at the biennial Governmental Meetings on Urban Air Quality in Asia, organized by the United Nations Environment Programme Regional Office for Asia Pacific (UNEP ROAP) and Clean Air Asia. The framework aims to harmonize approaches in tackling urban air pollution and other related areas among Asian countries.
The Guidance Framework supports strategic AQM by providing information and recommendations on key areas of an air quality management system. These seven guidance areas include (1) Ambient Air Quality Standards and Monitoring; (2) Emissions Inventory and Modeling; (3) Health and other Impacts; (4) Communicating Air Quality; (5) Clean Air Action Plans; (6) Governance; and (7) Financing Air Quality Management. The Guidance Framework documents are accessible online: www.cleanairasia.org/ibaq.
The Guidance Framework allows decision-makers and other stakeholders to ascertain the city’s management capacity to assess health impacts of air pollution in a locality. This understanding will be used to inform the development of prevention, mitigation and control strategies embedded in a Clean Air Action Plan (see Implementation and Design section). The tool also provides specific guidance in undertaking a proactive and participatory HIA. The Guidance Framework process can be used to establish a monitoring and evaluation plan to assess the short-, medium- and long-term impacts of implemented air pollution-reduction measures in school vicinities.

Tool Use and Target Stakeholders
The tool can be used by the following:
- Local policy and decisionmakers and other project implementing bodies to understand the health impacts of AQM strategies and air pollution-control measures to the public and targeted stakeholders (e.g., school children).
- School staff and educators as the foremost group in facilitating health impact monitoring and evaluation of air pollution-related measures and programs.
- School administrators as the lead decisionmaker in identifying future projects and programs for air quality improvement in schools.
Guidance for Stakeholders in Health Impact Assessment on Air Pollution
Step 1. Assess the management capacity to conduct HIA (Note: please put all four steps from this section as separate sub-tabs)
The type and scope of the HIA can be decided by decision makers after a health status and AQM capacity assessment is done. Below are indicators developed by Clean Air Asia to evaluate the mechanisms and methods for the assessment of health and other impacts of air pollution in a city. For each row, check the indicator that best describes the condition of AQM in your city per category. Count the number of checks per stage and write the stage with the highest tally in the blank provided after the table. The column with the highest tally is the AQM stage of the city and will become the basis for deciding the scope and detail of HIA that will be undertaken.
|
Indicator Categories |
Stages |
||||||
|
Underdeveloped |
Developing |
Emerging |
Maturing |
Fully developed
|
|||
|
Information for estimating health and other impacts |
☐ A health surveillance system[1] is not available ☐ Meteorological and air quality databases for emission-exposure-impacts modeling are not available |
☐ A health surveillance system is being developed ☐ Meteorological and air quality databases are being developed for emission-exposure-impacts modeling |
☐ A health surveillance system starts to provide reliable data ☐ Meteorological and air quality databases are beginning to be established and used for emission-exposure-impacts modeling
|
☐ A health surveillance system is in place and is becoming a basis of health impact assessment due to air pollution. ☐ Meteorological and air quality databases are routinely used for emission-exposure-impacts modeling. |
☐ A health surveillance system makes available reliable data and is always taken as the basis of health impact assessment due to air pollution ☐ Meteorological and air quality databases are regulated to be routinely used for emission-exposure-impacts predictions.
|
||
|
Estimating health impacts of air pollution |
☐ Anecdotal observations of and information on health impacts by health authorities are not available. |
☐ Initial observations on health impacts due to air pollution exposure exist. |
☐ Routine observations on health impacts due to air pollution exposure are becoming more and more common. |
☐ Systematic epidemiological studies on health impacts due to air pollution exposure are performed including exposure and health impact assessment studies of major facilities or areas and of vulnerable populations using rapid assessment techniques. |
☐ Systematic epidemiological studies on health impacts due to air pollution exposure are performed including exposure and health impact assessment studies of major facilities or areas and of vulnerable populations using sophisticated assessment techniques.
|
||
|
Capacity for estimating health and other impacts of air pollution |
☐ Lack of capacity for: • air pollution monitoring with cheap sensors or sophisticated analyzers with respect to health impact assessment • exposure assessment • health and environmental impact assessment |
☐ Capacity is being developed for: • air pollution monitoring with cheap sensors or sophisticated analyzers with respect to health impact assessment • exposure assessment • health and environmental impact assessment |
☐ Capacity is regularly enhanced by training for: • air pollution monitoring with cheap sensors or sophisticated analyzers with respect to health impact assessment • exposure assessment • health and environmental impact assessment |
☐ Capacity and understanding of issues are increased for: • air pollution monitoring with cheap sensors or sophisticated analyzers with respect to health impact assessment • exposure assessment • health and environmental impact assessment |
☐ Capacity and understanding of issues are sustainably enhanced for: • air pollution monitoring with cheap sensors or sophisticated analyzers with respect to health impact assessment • exposure assessment • health and environmental impact assessment |
||
|
Estimating environmental, economic, other impacts, and cost-benefits valuation |
☐ Studies on socioeconomic cost of pollution and benefits of pollution control are not available. ☐ Cost effectiveness/cost- benefit analysis is not conducted. |
☐ Limited studies on socioeconomic cost of pollution and benefits of pollution control are available, mostly performed by academic/research institutions. ☐ Cost effectiveness/ cost- benefit analysis is intermittently conducted by academic/ research institutions. |
☐ Studies on socioeconomic cost of pollution and benefits of pollution control are becoming more available, performed by both academic/research institutions and the government. ☐ Cost effectiveness/ cost- benefit analysis is conducted by academic/ research institutions and the government. |
☐ Studies on socioeconomic cost of pollution and benefits of pollution control are available, performed by academic/research institutions and the government. There is a process in place for estimating socio-economic costs adapted to local conditions. ☐ Cost-effectiveness/ cost-benefit analyses routinely performed by academic/research institutions and the government following a localized system for estimating costs and benefits. |
|
||
|
Presentation of results of health impacts assessment for policy |
☐ Health impacts assessment is not conducted |
☐ Presentation of results of health impact assessments, studies on socioeconomic cost of pollution, and cost-effectiveness/ cost-benefit analysis considers its use in AQM policy development, implementation, and evaluation |
☐ Presentation of results of HIA, studies on socioeconomic cost of pollution, and cost-effectiveness/ cost-benefit analysis systematically considers its use in AQM policy development, implementation, and evaluation |
☐ Presentation of results of HIA, studies on socioeconomic cost of pollution, and cost effectiveness/ cost-benefit analysis systematically considers its use in AQM policy development, implementation, and evaluation |
|
||
| Tally of checks | _________ | _________ | _________ | _________ | |||
Current AQM stage of the city: _____________________________________________________________________________
Step 2. Plan
Consider the following points and considerations during the planning phase:
People at risk ➞ Define the population and area of interest
Describe the exposure ➞ What are the kinds of air pollutants and the area of dispersion/spatial resolution
Possible health effects ➞ Consider both long– and short–term effects
For more efficient planning, HRA and HIA principles must be understood.
An HRA is the evaluation of the potential health risks due to exposure to a hazard (WHO, 2016), which in this case is air pollution. On the other hand, an HIA covers a broader extent of determining the impacts of activities and measures (e.g. policy, projects) with respect to the health risks.
The HRA process has four sub-steps (Schwela, 2014; Haq and Schwela, 2008) explained below in the context of AQM:
- Hazard identification: identification of the type and nature of adverse effects that specific air pollutants can inherently bring about in an organism, system, or (sub) population. Pre-existing studies are used for this. In the context of AQM, the specific air pollutants to be covered in the study needs to be identified. Available air pollution data must thus be mapped.
- Hazard characterization: description of the qualitative and quantitative properties of the air pollutant which makes it capable of causing adverse effects. Pre-existing studies are also used for this. Given the availability of existing reference studies proving its toxicity, PM5 is the most commonly studied hazard for air pollution risk assessment.
- Exposure assessment: identifies and defines the population’s exposures that has taken place in the past, currently happening, or are expected to occur. In this assessment, it must be known how much and how long the population was exposed to the risk or the pollutant of concern. For air pollution HRA, the amount of time spent indoors/outdoors are determined for the populations of interest.
- Risk assessment: data from the three previous steps are used to calculate for the known and potential adverse effects of the air pollutant to the population of interest, under defined exposure conditions.
Step 3. Gather data
After understanding the HRA/HIA process and planning accordingly based on the city’s AQM stage and available resources, the actual data collection can commence. Summarized below are the minimum data requirements that the stakeholders must collect in order to perform an HIA.
|
Data needs |
Remarks |
Data source |
|
Air pollution data |
· Concentration levels per air pollutant, through time (the higher the resolution, the better) · Background information on hazard characterization per pollutant |
➞ Environment Ministry or Department ➞ Pre-existing studies |
|
Population data |
· Data on exposed population (best if segregated per sex and age, if possible). |
➞ Statistics office; Census data; Official records |
|
Health Data |
· Records of mortality and morbidity cases (best if segregated per sex, age and by specific location; best if in ICD-10 categories) · Hospitalization and treatment costs |
➞ National or City Health offices; Census data; Hospitals; surveys; personal health records |
|
Dose- or Concentration-response function |
· In the form of an equation or formula |
➞ Pre-existing studies |
|
*Additional exposure data: patient history and background |
· If an HRA is going to be performed for a very specific cohort or group of subjects (e.g., school children), there should be collection of complete profile of the individual (e.g. occupation, lifestyle, pre-existing health conditions, etc.) |
➞ Surveys and interviews |
|
*Additional air quality modeling information |
· If air quality modeling is to be used to calculate ambient air pollutant concentrations from emissions inventory data, the following data is needed: meteorological, geographical data |
➞ Weather stations; Environment Ministry of Department |
Step 4. Conduct HIA
After the collection of all necessary data described in Step 2, proper data cleaning and formatting must be done for suitability of input with the chosen HIA tool or model/s. The HRA result will identify the specific health risk involved due to exposure to a specific air pollutant. The HIA, on the other hand, will provide a more wholistic and action-driven approach to link health and air pollution since it will identify the impact on health of doing (or the absence of) actions. The actions can be in the form of implementation of policies, ordinances, standards; approval/disapproval of a project which is also an emission source; change in strategies, or any event which can influence the level of air pollutants. For schools, this can be in the form of development projects, traffic management, and policies for pedestrians.
Available tools make HIA easier, and familiarity with them will help stakeholders make informed decisions on which tool(s) to use. Some of the software-based tools used for HIA include the following:
Environmental Benefits Mapping and Analysis Program (BenMAP) (See next section)
Air Quality Benefits Assessment Tool (AQBAT)
In writing the HIA report, there are no prescribed formats as long as all details on Phases 1 to 3 are presented. The implementors should indicate data availability, study limitation, as well as assumptions and data adjustments/corrections done. It would also help to discuss challenges encountered in all steps, and how these were resolved. All this information can help future HIA efforts and can thus contribute in sustaining the efforts of the city to protect public health, most especially children.
[1] Note: A health surveillance system collects data on mortality and morbidity for selected health impacts.
ENVIRONMENTAL BENEFITS MAPPING AND ANALYSIS PROGRAM – COMMUNITY EDITION (BENMAP-CE) (US ENVIRONMENTAL PROTECTION AGENCY)
About the Tool
The BenMAP-CE tool estimates the number and economic value of health impacts resulting from changes in air quality - specifically, ground-level ozone and fine particles (PM2.5) using health impact functions that are constructed using information from published epidemiology literature. The tool facilitates the understanding of health and economic benefits of improving air quality.
The latest version of BenMAP gives the advantage of flexibility for users. The BenMAP – CE (community edition) can perform a full-scale benefits assessment but easy enough for beginners to use. Users can load their own data or use pre-loaded data such as:
- Air quality data
- Demographic data
- Economic values
- Concentration – response relationships
Sample visuals generated by BenMAP CE are presented below, illustrating how the program calculates for health benefits due to improved air quality. The assumption is that through a policy or measure (i.e., at the institutional, community or city level) to reduce air pollution, there will be a change in the level of pollutants. The pollution change is related to the population in the study area (i.e., schools, community, or city), and the baseline incidence of health impacts. A built-in dose response function will lead to the calculation of the estimated effects, and ultimately the health impacts, which are represented by the number of deaths and morbidity avoided because of the decreased pollution level.
The economic benefits can also be quantified if economic input value such as cost of illness (COI) and value of statistical life (VSL) are available. The main output is that given the number of deaths and sicknesses avoided, this is the amount of money saved because we improved the quality of air.

Tool Use and Target Stakeholders
The tool can be used by the following:
- Local policy and decisionmakers and other project implementing agencies to project health impacts and economic consequence (at the city or national level) of AQM strategies and air pollution-control measures to the public and targeted stakeholders (e.g., school children).
- School administrators in collaboration with public health experts and local policy and decision makers, in identifying and prioritizing strategies and initiatives to ensure good health of school children, stakeholders and neighboring communities.
For full details on how to use BenMap, see the tool’s user manual here.
CASE STUDIES
A Multi–Pollutant, Risk–based Approach to Air Quality Management: Case study of BenMAP-CE Application for Detroit
To further understand the technical needs and challenges in implementing a multi-pollutant, risk-based approach to AQM, BenMAP-CE was applied to urban Detroit. As part of this case study, two air quality control strategies were assessed and compared. The “status quo”, where controls were selected separately to address O3 and PM2.5 non-attainment at monitor locations. The other strategy reflected a “multi– pollutant, risk–based” approach, which aimed at further reducing population risk from exposure to O3, PM2.5 and selected air toxics while still addressing ozone and PM2.5 non-attainment.
BenMAP was used in this study to assess how the two different strategies affect human health. Data on O3 and PM2.5 concentrations were consolidated from a Community Multiscale Air Quality (CMAQ) Modeling System for the Midwest domain to capture regional changes. Local effects, on the other hand, were captured through the PM2.5 concentrations from the Multiplicative Hybrid Approach that was conducted by the study. Due to paucity of local epidemiological studies suitable for the analysis, “EPA default” was used for both PM2.5 and O3 risk estimates and economic valuation functions.
The estimated PM2.5 and O3–related health impacts and monetized benefits for both control strategies are shown below. It was estimated that both control strategies yield substantial health benefits in the form of hundreds of avoided premature mortalities, dozens of avoided chronic illnesses including acute myocardial infarctions and chronic bronchitis, and dozens of avoided acute effects including asthma exacerbations, respiratory and cardiovascular hospitalizations and emergency department visits. It shows consistency with previous EPA analyses assessing PM2.5 and O3– related impacts, premature mortality represents the largest single monetized benefits category.

Another significant analysis is the monetized benefits which is approximately $1.1 B for the “Status Quo” control strategy versus $2.4 B (2006$,3% discount rate) for the “Multi–pollutant, Risk– based” control strategy, relative to the 2020 baseline.

For PM2.5, the estimates show both the local and regional benefits. The local benefits were $610 million and the regional benefits were $520 million for the “Status Quo” control strategy while the local and regional benefits were $1,600 million and $810 million, respectively, for the “multi–pollutant, risk–based” control strategy. For O3, we analyzed the benefits for the entire Midwest CMAQ domain, which were $0.9 million for the “Status Quo” control strategy and $2.1 million for the “Multi–pollutant, Risk–based” control strategy. Based on the analysis, it was concluded that the “Multi–pollutant, Risk–based” control strategy produced approximately two times greater monetized benefits for PM2.5 and O3.
Estimating the Health and Economic Impacts of Changes in Local Air Quality using BenMAP-CE
An illustration of a local health impact assessment using BenMAP-CE, in the area of the Dallas–Fort Worth region of Texas was conducted in 2018. BenMAP-CE was used to integrate local air quality data with previously published concentration–response and health–economic valuation functions to estimate the health effects of changes in air pollution levels and their economic consequences.
A local HIA of O3 changes in the 10-county non-attainment area of the Dallas–Fort Worth region of Texas was carried out, estimating the short-term effects on mortality predicted by two scenarios for three years (2008, 2011, and 2013): (1) incremental rollback of the daily 8-hour maximum ozone levels by 10 parts per billion, and (2) a rollback-to-a-standard ambient level of 65 parts per billion. Various health impact functions can be run per scenario.
Result shows that estimates of preventable premature deaths attributable to O3 air pollution obtained by the incremental rollback method varied little by year, whereas those obtained by the rollback-to-a-standard method varied by year and were sensitive to the choice of ordinality and the use of preloaded or imported data. Moreover, an incremental rollback scenario, as much as 116 deaths would have been avoided (year 2011), avoiding as much as 932 million USD in related costs.
The demonstration shows how BenMAP-CE allows local and regional public health analysts to generate timely, evidence-based estimates of the health impacts and economic consequences of potential policy options in their communities.
Addressing London’s toxic air
Air pollution damages child health and development, including during pregnancy, and is estimated to have contributed to more than 9,000 premature deaths in London each year.
London introduced a new ultra-low emissions zone (ULEZ) in April 2019 to cut down on polluting vehicles. The zone covers central London and is one of the strictest in the world, operating 24 hours a day. The city has also funded audits to assess air quality in schools and nurseries, tested air quality interventions like anti-idling and “barrier bushes” to protect playgrounds, and expanding walking and cycling as part of a ‘healthy streets’ approach. In total it is nearly doubling funding to tackle air pollution overall. It is also monitoring real-world emissions through the TRUE initiative, including using this data to inform policy decisions, such as accelerating the transition to electric taxis.
After six months, there were 38% fewer polluting vehicles in the low emissions zone, significantly reducing pollutants like nitrogen dioxide. Compared to February 2017, nitrogen dioxide levels were 36% lower in September 2019. London is also supporting school streets, roads closed off around school opening and closing time to reduce air pollution and make roads safer.
Read more about Air Pollution in Early Childhood
Read more about London’s approach
Contains excerpts from Bernard van Leer Foundation document


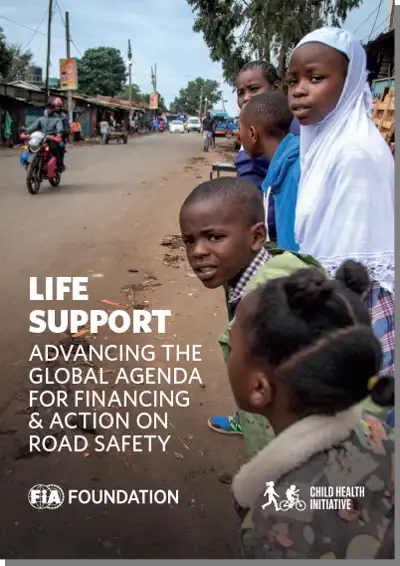
Life Support - Advancing the Global Agenda for Financing and Action on Road Safety
In far too many countries road traffic injuries and fatalities are increasing. We need to accelerate progress in delivering road safety around the world and for this, financing is critical. Yet too often, even when financing is available for roads and transportation, effective road safety is not the outcome. ‘Life Support’ presents the priority actions needed in order to strengthen financing and deliver results through to 2030.